Set Up Alerts for Kubernetes Containers

Setting up alerts for Kubernetes containers helps you detect and address issues before they impact users. Kubernetes environments are dynamic, making monitoring essential to maintain cluster health and performance. Here’s a quick breakdown:
- Why Alerts Matter: Alerts notify teams of resource exhaustion, pod failures, or network issues, enabling faster responses and minimizing disruptions.
- Tools You Need: Prometheus collects metrics, Alertmanager routes notifications, and Grafana visualizes data.
- Key Steps:
- Ensure your Kubernetes cluster is healthy.
- Deploy monitoring tools like
kube-prometheus-stack. - Configure Prometheus to gather metrics and write alert rules using PromQL.
- Set up notification channels (e.g., Slack, email, PagerDuty) in Alertmanager.
- Regularly review and fine-tune alerts to reduce false positives and improve accuracy.
- Example Alerts: High CPU usage, low disk space, or HTTP error rates exceeding 5%.
Set up Prometheus Alert Manager for Kubernetes Cluster with Custom Alerts | Kubernetes Monitoring
Prerequisites and Environment Setup
Laying the groundwork is crucial to ensure your alerting system runs smoothly and reliably.
Check Kubernetes Cluster Setup
Before diving into monitoring and alerting, make sure your Kubernetes cluster is functioning properly. Start by checking the health of your nodes:
kubectl get nodes If any nodes are not in the "Ready" state, address the issues immediately. Next, confirm that the Kubernetes API server is responsive:
kubectl cluster-info This command should return details about your cluster’s control plane endpoints without any connection issues.
If you’re using a managed Kubernetes service, verify that you have the necessary permissions to deploy monitoring tools and create cluster-wide resources. Most setups require cluster-admin privileges or specific RBAC configurations to gather metrics across namespaces and system components.
Once your cluster is healthy, you can move forward with installing the monitoring stack.
Install and Set Up Monitoring Tools
Your monitoring stack is the backbone of your alerting system. Prometheus handles metrics collection and storage, while Alertmanager manages alerts and their routing.
Deploy the kube-prometheus-stack Helm chart, which bundles Prometheus, Alertmanager, Grafana, Node-Exporter, and Kube-State-Metrics. This all-in-one approach simplifies setup and ensures compatibility. In July 2024, Anvesh Muppeda demonstrated the effectiveness of this method by deploying the stack and creating custom alert rules to monitor Kubernetes health. His setup successfully identified and reported a simulated failure caused by a pod with an incorrect image tag.
| Tool | Role | Installation Method |
|---|---|---|
| Prometheus | Metrics collection and monitoring | Helm |
| Alertmanager | Alert routing and notification | Helm |
| Grafana | Dashboard creation and visualization | Helm |
To get started, add the Prometheus community Helm repository, then deploy the chart with custom values. This setup provides a solid foundation with defaults that you can tweak as needed. Once installed, Prometheus will automatically discover services in your cluster and begin collecting metrics.
For those who want more control, you can install Prometheus and Alertmanager separately using their individual Helm charts or Kubernetes manifests. The Prometheus Operator is another option, offering automated management of Prometheus instances and configurations. This is especially useful for larger or more complex setups.
After installation, confirm that Prometheus is scraping metrics from your services and nodes. In the Prometheus web interface, check that all targets are listed as "UP", indicating successful metrics collection.
Once metrics are flowing, it’s time to set up notification channels to ensure your team stays informed.
Set Up Notification Channels
Notification channels are essential for alerting your team promptly, whether through email, Slack, SMS, or other methods.
"Alertmanager is a critical part of any production Kubernetes setup. It’s not just about sending notifications – it’s about creating a system that helps your team act early, respond confidently, and prevent incidents from escalating."
- Bavithran, Senior Cloud & DevOps Engineer
Start by configuring your primary notification method. For email alerts, you’ll need access to an SMTP server along with the correct host, port, and authentication details. Many teams opt for services like SendGrid or Amazon SES.
For Slack notifications, create a webhook and configure Alertmanager to route alerts based on severity. This ensures critical alerts are seen instantly, enabling faster collaboration and response.
Define escalation paths to prioritize alerts. For example:
- Critical alerts: Trigger phone calls or SMS notifications.
- Lower-priority alerts: Send messages via Slack or email.
Using labels like "severity" and "team" helps route alerts to the right people without overwhelming everyone.
Don’t forget to configure silencing for planned maintenance. Alertmanager’s silencing feature allows you to mute specific alerts temporarily, keeping your notification channels free of unnecessary noise during scheduled downtime.
Finally, test each notification channel thoroughly. Send test alerts to confirm that messages are delivered quickly and include all the details your team needs to respond effectively.
With these steps completed, your environment is ready for the next phase: setting up precise alert rules in Prometheus.
Set Up Monitoring and Metrics Collection
Now that your environment is ready, the next step is configuring Prometheus to gather the metrics essential for powering your alerting system. This process transforms your setup from a basic installation into a robust data collection engine.
Deploy and Configure Prometheus
Prometheus is highly effective at monitoring Kubernetes due to its pull-based model, multi-dimensional data structure, and built-in service discovery capabilities. Here’s how to get it up and running:
- Set Up RBAC: Create a service account within the monitoring namespace and bind it to a cluster role. This role should have read access to nodes, pods, services, and endpoints, enabling Prometheus to automatically discover targets and collect system-level metrics.
- Configure Persistent Storage: Use a persistent volume claim (at least 50GB for small clusters). Adjust storage size according to your retention needs and the volume of metrics, ensuring data is preserved during pod restarts.
- Deploy Node Exporter: Use a DaemonSet to run the node exporter on every cluster node. This tool collects essential infrastructure metrics like CPU, memory, disk usage, and network activity, forming the foundation for alerting rules.
- Set Scrape Intervals: Define scrape intervals based on service criticality. For example, set intervals of 15–30 seconds for critical services and 1–2 minutes for less critical components.
- Enable Service Discovery: Configure automatic detection and scraping of metrics from Kubernetes targets to streamline monitoring in dynamic environments.
Configure Service Discovery
In Kubernetes, where pods and services are always changing, service discovery is key. Prometheus simplifies this by offering predefined mechanisms tailored for Kubernetes, allowing it to find and monitor targets without manual input.
Set up the following Kubernetes service discovery types in your prometheus.yml file:
| Discovery Type | Purpose | Metrics Collected |
|---|---|---|
kubernetes_nodes |
Node-level monitoring | CPU, memory, disk, network |
kubernetes_pods |
Pod-level monitoring | Container metrics, resource usage |
kubernetes_services |
Service endpoint discovery | Application-specific metrics |
kubernetes_endpoints |
Endpoint monitoring | Service availability, response times |
kubernetes_ingress |
Ingress controller metrics | Traffic patterns, SSL status |
To optimize storage and ensure consistency, use target relabeling. This allows you to filter out unnecessary metrics and adjust labels before scraping. For instance, you can exclude system pods that don’t need alerting or rename labels to align with your organization’s standards.
Annotate pods with prometheus.io/scrape and prometheus.io/port to enable auto-discovery. Once configured, check the Prometheus targets page to verify that all intended targets are listed with an "UP" status. Metrics from newly deployed services should start appearing within your specified scrape interval.
Connect with Kubernetes API
Prometheus leverages the Kubernetes API to collect live metrics from nodes, pods, deployments, and other objects. This integration provides a complete view of both infrastructure and application performance.
- Extend RBAC for API Access: Update RBAC policies to grant Prometheus access to core API groups, apps, extensions, and any custom resource definitions. Bind these permissions to your monitoring namespace.
- Configure API Server Metrics: Add a
kubernetes-apiserversjob to your Prometheus configuration. This enables collection of metrics like request rates and error rates, which are critical for monitoring API server performance. - Use ServiceMonitors: Define ServiceMonitors to specify which services Prometheus should monitor. These use label selectors to dynamically discover targets, adapting as new applications are deployed.
- Secure Communication: Enable HTTPS for Prometheus endpoints and its web interface. Configure TLS certificates and update your ingress or service settings to encrypt data exchanges between Prometheus and its targets.
Test the API integration by querying metrics such as kube_pod_status_phase or kube_node_status_condition. These should reflect real-time changes in your cluster, confirming that Prometheus is successfully connected to the Kubernetes API and collecting all the data needed for effective monitoring and alerting.
With these configurations in place, your monitoring system is ready to support intelligent alerting, ensuring your team is notified of potential issues before they escalate.
Create Alert Rules in Prometheus
Now that you’ve set up metrics collection, it’s time to create alert rules in Prometheus. These rules notify you when specific conditions arise, helping you stay on top of potential issues in your Kubernetes environment. Prometheus uses PromQL (Prometheus Query Language) to define these alert conditions, turning raw metrics into actionable notifications.
Write Alert Rules with PromQL
PromQL is designed to query time-series data and trigger precise alerts. Alert rules are written in YAML configuration files, where each rule specifies the condition, duration, and metadata such as labels and annotations.
Here’s an example of an alert rule for monitoring high CPU usage:
groups: - name: kubernetes_node_alerts rules: - alert: HighCPUUtilization expr: avg(node_cpu{mode="system"}) > 80 for: 5m labels: severity: critical annotations: summary: High CPU utilization on host {{ $labels.instance }} description: The CPU utilization on host {{ $labels.instance }} has exceeded 80% for 5 minutes. This rule triggers an alert when the average CPU usage exceeds 80% for five minutes, ensuring temporary spikes are ignored while sustained issues are flagged.
Container-Specific Monitoring: Keep an eye on metrics that directly affect container performance, such as memory, disk space, and error rates. For instance, you can set up a low disk space alert:
- alert: LowDiskSpace expr: node_filesystem_free{fstype="ext4"} < 1e9 for: 5m labels: severity: critical annotations: summary: Low disk space on host {{ $labels.instance }} description: The free disk space on host {{ $labels.instance }} has dropped below 1GB. Application Performance Alerts: Monitor application-level metrics like HTTP error rates. The following example tracks if 5% or more of HTTP requests return 500 status codes:
- alert: HighRequestErrorRate expr: (sum(rate(http_requests_total{status="500"}[5m])) / sum(rate(http_requests_total[5m]))) > 0.05 for: 5m labels: severity: critical annotations: summary: High request error rate description: The error rate for HTTP requests has exceeded 5% for 5 minutes. Include detailed annotations in your alerts, and group related alerts together for easier management.
Set Alert Severity Levels
Categorizing alerts by severity ensures your team responds appropriately to different issues. This approach helps prioritize responses, reduces unnecessary alerts, and ensures critical problems are addressed promptly.
Severity Classification: Use a three-tier system for severity:
- Critical: Immediate threats to system availability or data integrity. These require a 24/7 response.
- Warning: Potential issues that need attention but can wait for business hours.
- Informational: Notifications about system changes or trends that don’t require action.
| Severity Level | Response Time | Notification Method | Example Scenarios |
|---|---|---|---|
| Critical | Immediate (24/7) | SMS, Phone, Slack | Node failures, service outages, security breaches |
| Warning | Within 4 hours | Email, Slack | High resource usage, performance degradation |
| Informational | Next business day | Email, Dashboard | Deployment notifications, capacity trends |
Align Severity with Business Impact: Severity levels should reflect the potential impact on your business. For example, a database connection failure might be critical for an e-commerce platform but less urgent in a testing environment. Consider factors like customer experience, revenue, and compliance when defining severity levels.
Actionable Alerts: Ensure your alerts provide clear, actionable information. For example:
- Critical Node Outage: "Node-3 Unavailable. Node-3 has been unreachable for 5 minutes. Impacted pods: nginx-deployment-7595465465, redis-6546545645. Triggering event: network connectivity loss."
- High Memory Usage Warning: "frontend-pod-5546546546 (95% Usage). Memory usage has exceeded 95% for 10 minutes. Potential performance degradation."
"Effective alerting occurs when alerts are actionable and point directly to potential failures, performance issues, or security incidents."
Multi-Stage Alerting: Use warning thresholds before critical levels are reached, with different notification methods for each severity. This ensures early warnings without overwhelming your team with unnecessary alerts.
Use Historical Data for Smart Thresholds
Static thresholds often lead to false positives. By leveraging historical data, you can set dynamic thresholds that adjust based on trends and patterns.
Dynamic Thresholds: These thresholds adapt to changes in workloads and usage patterns, reducing noise while still catching critical issues. For example:
groups: - name: RateChangeAlerts rules: - alert: CPUUsageSpike expr: | rate(node_cpu_seconds_total{mode="idle"}[5m]) > 0.3 for: 5m annotations: summary: "Sudden CPU usage spike" description: "CPU usage increased by more than 30% in the last 5 minutes." Historical Comparisons: Use PromQL functions like max_over_time() and avg_over_time() to compare current metrics against historical baselines. Here’s an example for monitoring CPU usage:
groups: - name: DynamicThresholds rules: - alert: CPUUsageHigh expr: | max_over_time(node_cpu_seconds_total{mode="idle"}[5m]) < 0.15 for: 10m annotations: summary: "High CPU usage detected" description: "CPU usage exceeded 85% over the last 5 minutes." Time-Based Thresholds: Adjust thresholds to account for predictable usage patterns, such as higher traffic during weekends or holidays. Prometheus functions like day_of_week() and hour() can help create time-aware alert conditions.
Always test your alerts in a staging environment before deploying them in production. Regularly review and update your alert rules to ensure they remain accurate as your system evolves.
"Prometheus is an excellent tool to alert on key metrics in cloud-native environments. Prometheus’s flexible query language and integration capabilities make it a versatile solution for efficient monitoring and alerting at scale."
Once your alert rules are in place, you can move on to configuring alert routing and notifications.
sbb-itb-f9e5962
Configure Alert Routing and Notifications
Once you’ve defined your alert rules, the next step is to configure Alertmanager to efficiently route those alerts. Alertmanager acts as the central hub, collecting alerts from Prometheus and directing them based on label matching.
Set Up Alertmanager for Alert Routing
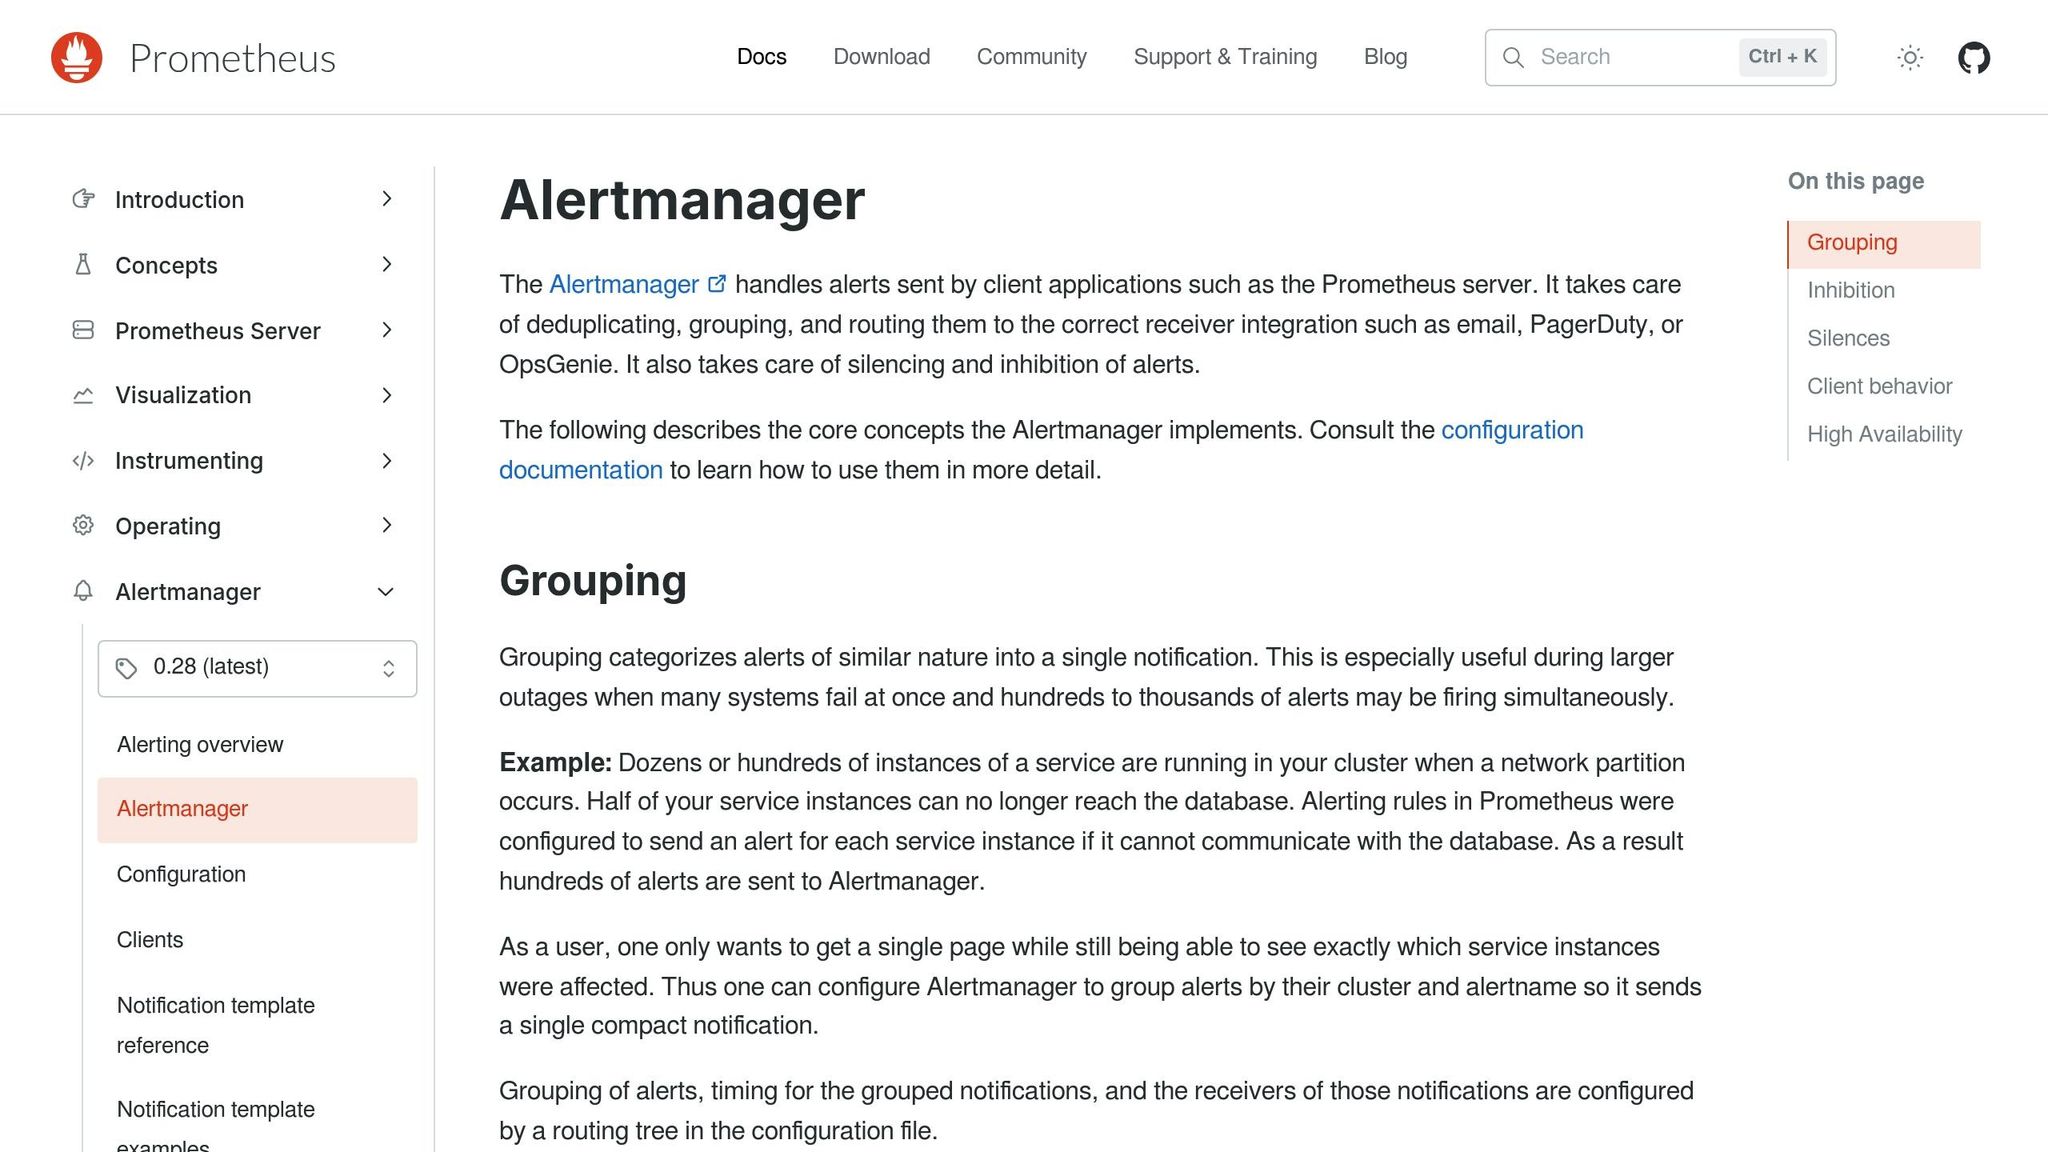
Alertmanager uses a routing tree structure to decide where each alert should go. It matches specific labels in the alert and sends them to the appropriate receiver. The routing process works from top to bottom, evaluating rules in the configuration file. Here’s an example of how you can route alerts based on team responsibilities:
route: receiver: slack-default # Fallback receiver for unmatched alerts routes: - receiver: pagerduty-logging continue: true - match: team: support receiver: jira - match: team: on-call receiver: pagerduty-prod In this configuration:
- Alerts labeled
{team:on-call}are routed topagerduty-prod. - Alerts for the support team go to JIRA.
- Any alerts that don’t match these criteria are sent to the fallback receiver,
slack-default.
Advanced Routing with Matchers: You can create more complex routing rules using multiple label matchers. For instance, the following configuration routes alerts from specific services and escalates critical ones:
route: routes: - matchers: - service=~"^(frontend|backend|database)$" receiver: team-X-mails routes: - matchers: - severity="critical" receiver: team-X-pager Here, alerts from services like frontend, backend, or database are sent to email notifications, while critical alerts are escalated to a pager system.
Grouping and Throttling: To prevent notification overload, configure grouping and throttling. These settings allow related alerts to be grouped before being sent:
group_wait: Delays the initial notification to group related alerts.group_interval: Sets the frequency for sending additional alerts in the same group.repeat_interval: Determines how often unresolved alerts are re-sent.
For example:
route: receiver: 'default-receiver' group_wait: 30s group_interval: 5m repeat_interval: 4h group_by: [cluster, alertname] Connect with Notification Platforms
Slack Integration: To send alerts to Slack, create a webhook URL and configure a receiver in Alertmanager:
receivers: - name: 'slack-notifications' slack_configs: - api_url: 'https://hooks.slack.com/services/YOUR/SLACK/WEBHOOK' channel: '#alerts' title: 'Kubernetes Alert' text: '{{ range .Alerts }}{{ .Annotations.summary }}{{ end }}' This setup posts alerts to the #alerts channel, including a summary of the Kubernetes alert.
Email Notifications: Configure email alerts using SMTP settings. Here’s an example for Gmail:
global: smtp_smarthost: 'smtp.gmail.com:587' smtp_from: 'alerts@yourcompany.com' smtp_auth_username: 'alerts@yourcompany.com' smtp_auth_password: 'your-app-password' receivers: - name: 'email-notifications' email_configs: - to: 'devops-team@yourcompany.com' subject: 'Kubernetes Alert: {{ .GroupLabels.alertname }}' body: | {{ range .Alerts }} Alert: {{ .Annotations.summary }} Description: {{ .Annotations.description }} {{ end }} PagerDuty Integration: For critical issues requiring immediate attention, integrate PagerDuty like this:
receivers: - name: 'pagerduty-critical' pagerduty_configs: - service_key: 'YOUR_PAGERDUTY_SERVICE_KEY' description: '{{ .GroupLabels.alertname }}: {{ .GroupLabels.instance }}' Routing to Multiple Channels: To ensure critical alerts are delivered via multiple channels, use configurations like this:
routes: - receiver: 'slack-immediate' matchers: - severity="critical" continue: true - receiver: 'email-logging' matchers: - severity="critical" In February 2024, organizations using Calico Enterprise integrated Prometheus Alertmanager with PagerDuty, improving incident response times and automating workflows. This integration simplified alert handling, enabling faster resolutions.
Configure Escalation and Maintenance Windows
After setting up notification channels, you can refine alert delivery by configuring escalation paths and silences for maintenance periods.
Silencing for Maintenance: Temporary silences can suppress alerts during scheduled maintenance or while addressing known issues. This reduces unnecessary notifications during these periods.
Time-Based Routing: Alerts can be routed differently based on the time of day or week. For example, you might send alerts to one team during business hours and another team after hours:
route: receiver: 'default-receiver' routes: - receiver: 'dev-pager' matchers: - service="inhouse-service" mute_time_intervals: - offhours - holidays continue: true - receiver: 'on-call-pager' matchers: - service="inhouse-service" active_time_intervals: - offhours - holidays time_intervals: - name: offhours time_intervals: - times: - start_time: '17:00' end_time: '09:00' weekdays: ['monday:friday'] - times: - start_time: '00:00' end_time: '23:59' weekdays: ['saturday', 'sunday'] Inhibition Rules: To avoid redundant alerts, set up inhibition rules. For instance, if a root cause alert like NodeDown is active, you can suppress related alerts like InstanceDown:
inhibit_rules: - source_matchers: - alertname="NodeDown" target_matchers: - alertname="InstanceDown" equal: ['instance'] Escalation Timing: Combine routing with time intervals to create progressive escalation paths. This approach reduces notification fatigue while ensuring critical issues get the attention they need. For example:
routes: - receiver: 'email-first' matchers: - severity="warning" group_wait: 30s routes: - receiver: 'slack-escalation' matchers: - severity="warning" group_wait: 10m routes: - receiver: 'pager-final' matchers: - severity="warning" group_wait: 30m This setup sends initial warnings via email, escalates to Slack after 10 minutes, and finally triggers PagerDuty alerts after 30 minutes if the issue persists.
Monitor, Maintain, and Optimize Alerts
Once your alerts are set up, the next step is to ensure they remain effective over time. Regular maintenance and fine-tuning are key to avoiding alert fatigue and keeping your system dependable.
Review and Adjust Alert Rules
Take time every 30–60 days to revisit your alert rules. Look at historical data and adjust thresholds to reflect actual patterns. For instance, if CPU usage often spikes to 80% during peak hours but only happens at 3:00 AM, use that context to set thresholds that flag real anomalies. This ongoing review ensures your alerts stay relevant as your system evolves.
Suppress short-lived spikes: Use a for parameter in Prometheus alert rules to prevent alerts from triggering on brief, insignificant changes:
- alert: HighCPUUsage expr: cpu_usage_percent > 85 for: 5m annotations: summary: "High CPU usage detected" description: "CPU usage has been above 85% for more than 5 minutes" Combine metrics for better accuracy: Pairing metrics can help reduce false positives. For example, high memory usage combined with an elevated error rate points more clearly to a real issue:
- alert: ApplicationUnderStress expr: (memory_usage_percent > 90) and (error_rate > 0.05) for: 3m annotations: summary: "Application experiencing stress" Prioritize alerts by severity: Group alerts into categories like critical, warning, and informational. Critical alerts demand immediate action, while warnings can often wait until regular working hours. This prioritization ensures your team focuses on what matters most.
Track alert performance: Monitor metrics such as false positive rates, resolution times, and overall alert frequency. If you notice too many unnecessary alerts, revisit your thresholds or conditions to refine them.
Use adaptive thresholds: Dynamic thresholds that adjust based on historical trends can help you avoid unnecessary alerts. For instance, an application might typically use 60% CPU during the day but only 20% at night. Setting thresholds that account for these patterns can improve accuracy.
Automate Alerts and Responses
Automation helps handle routine issues and provides better insights for complex problems, making your alerting system more efficient.
Make alerts actionable: Include detailed context and suggested actions in your alert messages:
annotations: summary: "Critical Node Outage: Node-3 Unavailable" description: "Node-3 has been unreachable for 5 minutes. Impacted pods: nginx-deployment-7595465465, redis-6546545645. Triggering event: network connectivity loss." action: "Initiate failover to the backup node. Investigate network connectivity issues." Tailor responses by severity: Send low-priority alerts to email or Slack, while critical ones go to SMS or trigger automated scripts. For example, if a pod keeps crashing, automate scaling up replicas and notify the team.
Integrate with incident management tools: Connecting your alerting system with platforms like PagerDuty or Opsgenie can streamline workflows. Automatically create incidents, assign them to on-call engineers, and track progress until resolution.
Automate fixes for recurring issues: If a service frequently runs out of memory, set up automation to increase resource limits and restart the pod when usage exceeds 95%.
Plan for maintenance windows: Suppress alerts during scheduled maintenance or deployments to avoid unnecessary notifications when changes are already being managed.
These steps not only make your alerting system smarter but also free up your team to focus on more strategic tasks.
Use TECHVZERO for Alert Optimization
TECHVZERO takes your alerting system to the next level with advanced automation and integrations, making it easier to manage and more reliable.
Custom alert tuning: TECHVZERO analyzes your workload patterns to fine-tune alert thresholds. By using historical data, they create rules that minimize false positives while catching real issues early.
Self-healing systems: Their DevOps solutions include automated responses to routine problems, reducing downtime and letting your team focus on bigger challenges.
Optimized performance: TECHVZERO ensures your Prometheus and Alertmanager setups are configured to handle your scale without becoming a bottleneck.
Cost-efficient monitoring: With expertise in cloud cost management, TECHVZERO designs alert systems that balance thorough coverage with resource efficiency, avoiding unnecessary costs.
Seamless integration: They connect your alerting system with tools like ticketing platforms, chat apps, and deployment pipelines, aligning everything with your existing workflows.
With TECHVZERO’s expertise, you can streamline your alerting processes while ensuring your system remains efficient and effective.
Conclusion
Setting up effective Kubernetes alerts involves deploying Prometheus, configuring Alertmanager, and crafting precise PromQL alert rules. The goal is to create actionable alerts with clear, relevant context, enabling teams to quickly detect anomalies and respond proactively.
To maintain peak performance, it’s essential to regularly review alert thresholds, group similar notifications, and automate responses to common issues. These steps ensure your alerting system remains efficient and responsive over time. By refining these processes, teams can focus on more strategic tasks while minimizing disruptions.
For organizations looking to take their alerting systems to the next level, working with experts can make a big difference. TECHVZERO, for instance, specializes in turning unreliable alert setups into dependable early warning systems. Their clients have reported impressive results, including a 40% reduction in cloud costs within just 90 days, five times faster deployments, and a 90% drop in downtime. One Engineering Manager shared:
"After six months of struggle, Techvzero fixed our deployment pipeline in TWO DAYS. Now we deploy 5x more frequently seamlessly. Our team is back to building features instead of fighting fires".
With an optimized Kubernetes alerting system in place, your team can focus on innovation and growth rather than constantly putting out fires.
FAQs
What are the main advantages of using Prometheus and Alertmanager to monitor Kubernetes environments?
Prometheus and Alertmanager are invaluable for keeping Kubernetes environments running smoothly. They enable early issue detection and instant notifications, helping you catch problems like application restarts, CPU throttling, or memory overuse before they spiral out of control.
Beyond just detecting issues, these tools simplify alert handling by cutting down on false alarms and ensuring notifications reach the right team members. Their scalability and seamless integration with Kubernetes make them a practical and efficient choice for maintaining system reliability and performance.
How can I minimize false alerts in my Kubernetes monitoring system to focus only on critical issues?
To cut down on false alerts in your Kubernetes monitoring system, start by adjusting alert thresholds to align with the typical behavior of your environment. Incorporate inhibition rules to mute alerts during expected changes, like scheduled maintenance or regular traffic surges. This helps prevent unnecessary distractions during predictable events.
You can also leverage AI-driven anomaly detection to distinguish between routine variations and actual problems. Another key step is setting appropriate recording intervals and organizing related resources with tags or labels. This approach ensures alerts are more precise and relevant, allowing your team to concentrate on critical issues. By refining your alerting process, you can reduce unnecessary noise and enhance response times.
What are the best practices for setting up alert notifications in Kubernetes to ensure fast and effective responses?
To handle Kubernetes alerts effectively and ensure timely responses, consider these practical steps:
- Enable multiple notification channels: Set up alert receivers such as email, Slack, or PagerDuty to make sure critical messages are delivered to the right people without delay.
- Group similar alerts together: Consolidate related alerts to minimize noise and prevent your team from being flooded with excessive notifications.
- Silence alerts during maintenance: Temporarily mute alerts during scheduled maintenance periods to avoid unnecessary distractions and reduce alert fatigue.
- Focus on critical alerts: Define routing rules so that high-priority alerts are sent directly to the team members who can address them promptly.
These steps can help you build a more streamlined and responsive alerting system for your Kubernetes setup.