Best Practices for SLO Alerts
When your system’s reliability dips, SLO alerts help you focus on what matters most: user experience. Unlike traditional alerts that flag every minor issue, SLO alerts notify you when your service’s error budget is depleting too quickly or when SLIs deviate from targets. This approach reduces noise and ensures your team addresses user-impacting problems promptly.
Key Takeaways:
- What Are SLO Alerts? Notifications triggered when error budgets are consumed faster than expected, directly tied to user-facing service reliability.
- Why Do They Matter? They minimize alert fatigue by focusing on critical, customer-impacting events, helping teams prioritize stability over new features when needed.
- Effective Strategies:
- Use multi-window, multi-burn-rate alerts to balance detection speed and precision.
- Set fast-burn thresholds for immediate action and slow-burn thresholds for less urgent issues.
- Implement symptom-based alerts to monitor user-facing issues like high error rates or latency, rather than backend metrics.
- Actionable Alerts: Include clear descriptions, remediation steps, and direct links to dashboards or runbooks for faster resolution.
- Integration Tips: Route urgent alerts to paging systems and less critical ones to ticketing tools. Use automation to suppress duplicates and clear resolved alerts.
SLO alerts are not just about responding to incidents – they also guide teams in balancing innovation with stability by linking reliability directly to user experience.
How to Alert on SLOs using Error Budget Burn Rate // DoK Talks #81
How to Design Multi-Burn Rate Alerts
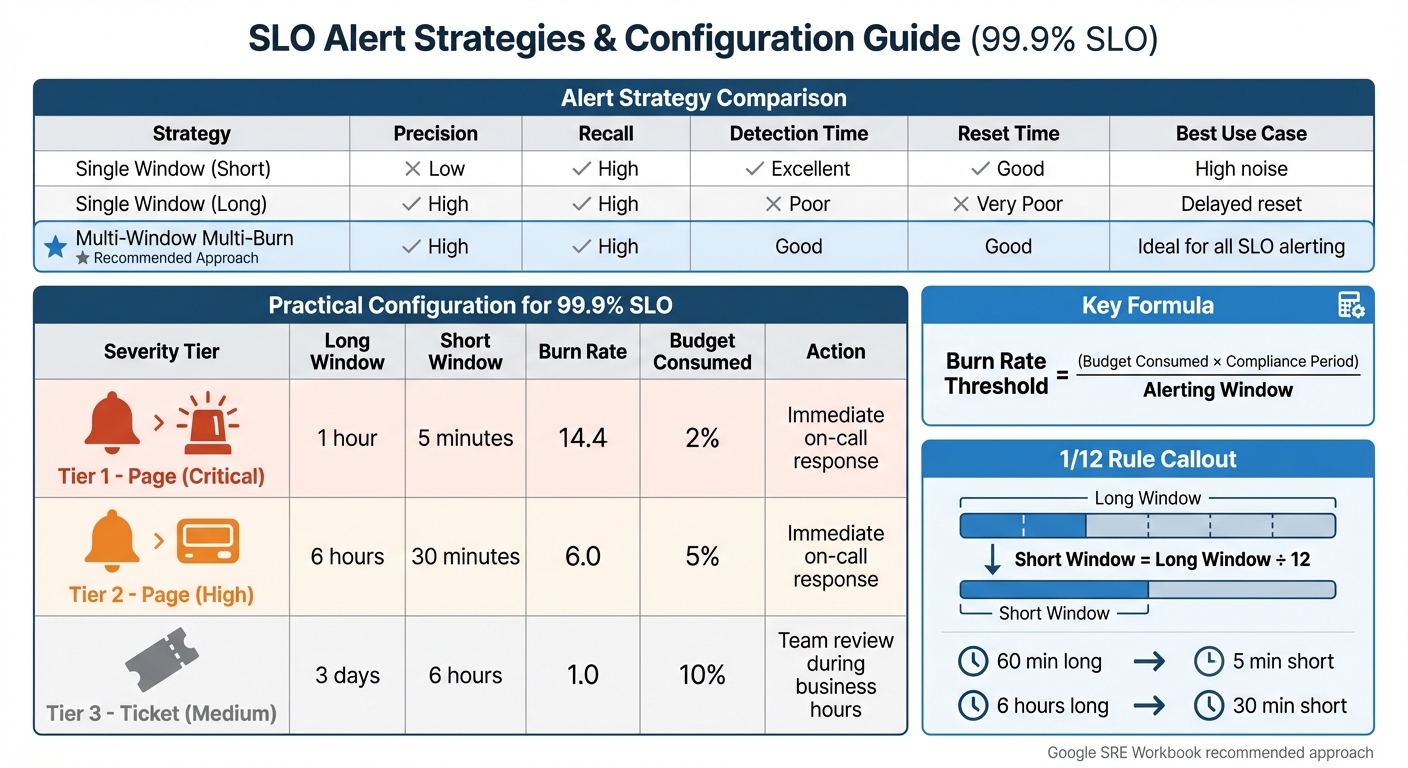
Multi-Window Multi-Burn Rate Alert Configuration for 99.9% SLO
Multi-burn rate alerts are a powerful tool to track how quickly your error budget is being used up across different timeframes. The burn rate measures the pace at which your budget is consumed relative to your SLO. For example, a burn rate of 1.0 means your budget will last exactly until the end of your compliance period. In extreme cases, such as a complete outage, the burn rate can spike to 1,000.
Understanding Burn Rate Thresholds
To fine-tune alert sensitivity, it’s crucial to set clear burn rate thresholds for different types of incidents. These thresholds help you differentiate between fast-moving, severe issues and slower, persistent ones:
- Fast-burn alerts: These are designed to catch critical problems quickly. For instance, targeting 2% budget consumption in just 1 hour corresponds to a burn rate of 14.4.
- Slow-burn alerts: These identify ongoing, less severe issues. Examples include targeting 5% budget consumption over 6 hours (burn rate of 6.0) or 10% consumption over 3 days (burn rate of 1.0).
To calculate your burn rate threshold, use this formula:
(Budget Consumed × Compliance Period) / Alerting Window.
Configuration Steps
Once your thresholds are set, you’ll need to configure alerts using a dual-window approach. This method combines a long window (to confirm the issue is significant) with a short window (to ensure the problem is still active). This setup helps reduce false positives and ensures alerts reset quickly after the issue is resolved.
When setting window durations, follow the 1/12 rule: make the short window about 1/12 the length of the long window. For example:
- Pair a 60-minute long window with a 5-minute short window.
- Pair a 6-hour long window with a 30-minute short window.
Fast-burn alerts should go to paging systems for immediate attention, while slow-burn alerts are better suited for ticketing systems.
For low-traffic services, a single failed request can lead to false alarms. To prevent this, set a minimum failure count threshold. If you’re using Prometheus, compare the error rate (failed requests / total requests) against (Burn Rate × Error Budget). For non-Prometheus data in Grafana, use "Grafana-managed" alert rules to break down complex multi-window logic into simpler queries.
Single vs. Multi-Window Alerts
Here’s a quick comparison of alert strategies:
| Alert Strategy | Precision | Recall | Detection Time | Reset Time | Best Use Case |
|---|---|---|---|---|---|
| Single Window (Short) | Low | High | Excellent | Good | High noise |
| Single Window (Long) | High | High | Poor | Very Poor | Delayed reset |
| Multi-Window Multi-Burn | High | High | Good | Good | Ideal for all SLO alerting |
The Google SRE Workbook supports this approach, stating: “Multiwindow, multi-burn-rate alerting technique is the most appropriate approach to defending your application’s SLOs”.
Practical Configuration Example
For a 99.9% SLO, here’s a recommended configuration:
| Severity | Long Window | Short Window | Burn Rate | Budget Consumed | Action |
|---|---|---|---|---|---|
| Page | 1 hour | 5 minutes | 14.4 | 2% | Immediate on-call response |
| Page | 6 hours | 30 minutes | 6.0 | 5% | Immediate on-call response |
| Ticket | 3 days | 6 hours | 1.0 | 10% | Team review during business hours |
This tiered setup strikes a balance between catching serious issues quickly and avoiding unnecessary noise. At TECHVZERO, we incorporate these best practices into our DevOps solutions to boost system reliability and ensure optimal performance.
How to Create Symptom-Based Alerts
Once you’ve got a handle on error budget monitoring with multi-burn rate alerts, it’s time to shift your attention to alerts that mirror the user experience. These are called symptom-based alerts, and they focus on what users actually encounter – things like slow page load times, spikes in 5xx error rates, or failed login attempts. Unlike internal system metrics, such as CPU usage or memory consumption, symptom-based alerts are all about what matters most: the user.
What makes these alerts stand out? Precision. They only trigger when real problems affect users, cutting down on unnecessary noise and reducing alert fatigue from temporary fluctuations that don’t impact the customer experience.
Why Symptom-Based Alerts Are More Effective
Traditional, cause-based alerts revolve around internal system metrics – like tracking high CPU usage or database connection errors. While these metrics are valuable for diagnosing system health, they often flag potential issues rather than actual user-facing problems.
Symptom-based alerts, on the other hand, focus on outcomes that directly affect users. For example, in request-driven services, you’d monitor availability and latency instead of internal system stats. A well-designed alerting system should ensure that over 70% of alerts prompt real, actionable responses from engineers.
"Treat the patient, not the alarm" – Honeycomb Documentation.
Here’s a real-world example: A video streaming platform managed to slash its daily alerts from 200 to just 40 and reduced average incident resolution times from 4 hours to 45 minutes. That’s the power of focusing on what users actually experience.
Symptom vs. Cause-Based Alert Examples
To better understand the difference, let’s look at some examples. A symptom-based alert might activate when there’s a noticeable rise in 5xx error rates or an increase in failed logins – clear signs of user impact.
In contrast, a cause-based alert might trigger when internal metrics show high CPU usage or low disk space. While these internal metrics are useful, they’re better suited for non-urgent notifications via tools like Slack or email. For critical paging, symptom-based alerts should take priority. Additionally, cause-based alerts can still play a role by acting as early warnings, such as monitoring saturation thresholds (e.g., disk space or memory limits) to plan maintenance before users are affected.
Symptom-Based vs. Cause-Based Alerts Comparison
| Feature | Symptom-Based Alerts | Cause-Based Alerts |
|---|---|---|
| Focus | User-facing impact (the "what") | Internal system state (the "why") |
| Examples | High latency, 5xx error rates, failed logins | High CPU usage, low disk space, high memory usage |
| Alert Quality | High precision; low noise | Lower precision; higher noise |
| Primary Use | Paging on-call engineers for incidents | Troubleshooting, auto-scaling, capacity planning |
| SLO Relation | Directly tied to SLOs and error budgets | Often used as triggers or saturation thresholds |
This breakdown highlights how symptom-based alerts align more closely with customer-focused SLOs, making them an essential part of any effective alerting strategy.
When setting up these alerts, start with the "Golden Signals" – availability and latency – since they capture the most common user-facing issues for request-driven services. In low-traffic environments, where a single failed request might cause a false alarm, you can create synthetic traffic to ensure a steady signal. This focus on user symptoms sets the stage for our next topic: balancing alert precision with recall.
sbb-itb-f9e5962
How to Balance Alert Precision and Recall
Crafting effective SLO alerts is all about finding the right balance between precision (reducing false alarms) and recall (catching every critical issue). For instance, a 10-minute window for a 99.9% SLO could generate up to 144 alerts daily while using just 0.02% of the monthly error budget. Narrow windows allow for quicker detection but can create noise, while broader windows reduce noise yet may delay detection and prolong alerts after issues are resolved. Striking this balance is key to avoiding alert fatigue while still catching incidents promptly.
What Precision and Recall Mean for Alerts
Precision ensures that alerts are relevant, helping on-call engineers focus on real problems. Recall, on the other hand, guarantees that no critical incidents slip through the cracks. These concepts play a vital role in enhancing the multi-window approach discussed earlier. Steven Thurgood, a Customer Reliability Engineer at Google, explains it well:
"Precision is 100% if every alert corresponds to a significant event. Recall is 100% if every significant event results in an alert."
Traditional alerting strategies often make you choose between these two metrics. For example, alerting on raw error rates with a short window may detect issues quickly but at the cost of low precision. Conversely, extending the window improves precision but can lead to alerts lingering long after an issue is resolved. Imagine using a 36-hour window – it might reduce false alarms but could also cause alerts to persist for 36 hours after a complete outage has ended.
Setting Detection and Reset Times
To refine alert performance, focus on configuring appropriate detection and reset times. The multi-window, multi-burn-rate strategy is particularly effective here. This approach uses two windows simultaneously: a long window (e.g., 1 hour) to determine if an issue is significant and a short window (e.g., 5 minutes) to confirm the problem remains active. Alerts only trigger when both windows exceed the defined burn rate threshold.
Consider this: for a 99.9% SLO, a burn rate of 1,000 – indicating a complete outage – can consume the entire monthly error budget in just 43 minutes. Multi-window alerts help detect such problems quickly and ensure the alert stops firing shortly after resolution, even if the longer window’s average remains elevated.
For practical implementation, the "2/5/10" rule is a good starting point:
- Page immediately if 2% of your budget is consumed in 1 hour (burn rate of 14.4).
- Page again if 5% is consumed over 6 hours (burn rate of 6).
- Create a ticket if 10% is consumed over 3 days (burn rate of 1).
In low-traffic environments, where even a single failed request can cause a large burn rate spike, set a minimum failures threshold. This ensures engineers aren’t paged for isolated errors that don’t point to systemic issues. For detailed threshold settings, refer to the configuration table in the previous section.
How to Connect SLO Alerts with Incident Response
Once you’ve fine-tuned your alerts, the next step is ensuring they lead to immediate and actionable responses. The goal is simple: alerts should clearly communicate what’s happening and how to address it. Here’s how to make your alerts effective and actionable.
How to Design Actionable Alerts
Good alerts answer two key questions right away: What’s happening? and What needs to be done? Start by crafting a clear and descriptive Name for the alert – for example, "API Gateway Error Rate Exceeds SLO." The Description should provide specific remediation steps, like "Check database connection pool" or a direct link to an internal incident playbook or runbook.
To make alerts even more useful, include dynamic variables such as {{timeframe}}, {{value}}, and {{SloDashboardUrl}}. These variables provide real-time context, like: "Error budget consumed 2% in 1 hour (burn rate: 14.4). View dashboard: [link]." Including this level of detail helps responders quickly assess the situation without wasting time searching through dashboards, which can significantly reduce resolution time.
Additionally, use labels and tags to ensure alerts are routed to the right team. For services with low traffic, consider setting a minimum failure threshold. This prevents unnecessary alerts for isolated errors that don’t indicate a larger issue.
Automating Incident Response Workflows
Integrate your SLO alerts with incident management tools like PagerDuty, Slack, Grafana OnCall, Jira, or ServiceNow. For fast-burn scenarios – like consuming 2% of your error budget in a single hour – set up alerts to trigger immediate pages. Meanwhile, slow-burn alerts, such as consuming 10% of the budget over three days, can generate tickets for review during regular business hours.
To keep your incident management system clean and efficient, enable auto-resolution for alerts. This feature automatically clears notifications once error consumption returns to normal levels, reducing clutter and manual cleanup. You can also implement alert suppression to avoid duplicate notifications, and group related violations into a single incident. These measures help combat alert fatigue and keep your team focused on critical issues.
Conclusion
Well-tuned SLO alerts can make the difference between a team that responds effectively and one that drowns in a sea of notifications. The secret lies in prioritizing critical events – the ones that genuinely threaten your error budget – over insignificant fluctuations.
The techniques outlined here – multi-window burn rate alerts, symptom-based monitoring, and urgency-driven routing – work in harmony to strike the right balance between precision and recall. This ensures that alerts are timely, relevant, and quickly resolved. Together, these practices create a solid framework for managing incidents effectively.
It’s important to acknowledge that 100% reliability isn’t a realistic goal.
"The number one source of outages is change: pushing new features, applying security patches, deploying new hardware, and scaling up to meet customer demand will impact that 100% target".
Your error budget is there to help you balance innovation with stability, so use it wisely.
To put these ideas into action, start by setting up multi-burn rate alerts and pairing them with symptom-based monitoring. Ensure your alerts include clear, actionable details, like links to runbooks. Route urgent alerts to pagers, while less critical ones can go to tickets or Slack. Regularly revisit your thresholds to make sure they’re aligned with actual system performance. And remember, your SLOs should mirror user expectations – not lofty, unattainable goals that only lead to frustration.
When implemented correctly, SLO alerts reduce downtime, minimize alert fatigue, and free up your team to focus on what matters most: delivering reliable systems for the people who count on them.
FAQs
What makes SLO alerts different from traditional monitoring alerts?
SLO alerts are built to keep an eye on a service’s overall health by tracking its Service Level Objective (SLO), with a particular emphasis on the error budget – the buffer that allows for some level of service interruptions. These alerts kick in when the error budget is being depleted too quickly, signaling potential threats to the service’s long-term reliability.
On the other hand, traditional alerts are usually tied to specific metric thresholds, like sudden spikes in CPU usage or memory consumption. While these alerts are great for flagging immediate, individual issues, SLO alerts take a step back and look at performance trends over time. This makes them especially useful for ensuring that service levels remain steady and reliable.
What are the advantages of using multi-window, multi-burn-rate alerts for SLO monitoring?
Multi-window, multi-burn-rate alerts are an excellent tool for managing Service Level Objectives (SLOs). They work by offering early warnings for sudden, short-term spikes in error budgets while also keeping an eye on long-term budget usage. This combination minimizes false alarms and allows teams to address potential problems before they escalate.
By keeping a close watch on both short-term and long-term trends, these alerts help maintain system reliability and prevent SLO breaches. The result? Better control over performance and a smoother experience for your users.
Why are symptom-based alerts better than cause-based alerts?
Symptom-based alerts are favored because they zero in on issues that users actually experience, rather than just internal system metrics. These alerts notify teams only when there’s a visible impact on users, cutting down on unnecessary distractions and helping teams focus on what’s truly important.
This method allows for quicker, more precise responses to problems that directly influence the customer experience, boosting both the efficiency of the team and the reliability of the system.