How to Detect Memory Leaks in Kubernetes

Memory leaks in Kubernetes can cause pods to crash, nodes to experience memory pressure, and clusters to become unstable. A memory leak occurs when an application continuously consumes memory without releasing it, eventually triggering Out of Memory (OOM) errors. These issues often result in OOMKilled events, CrashLoopBackOff states, and performance degradation.
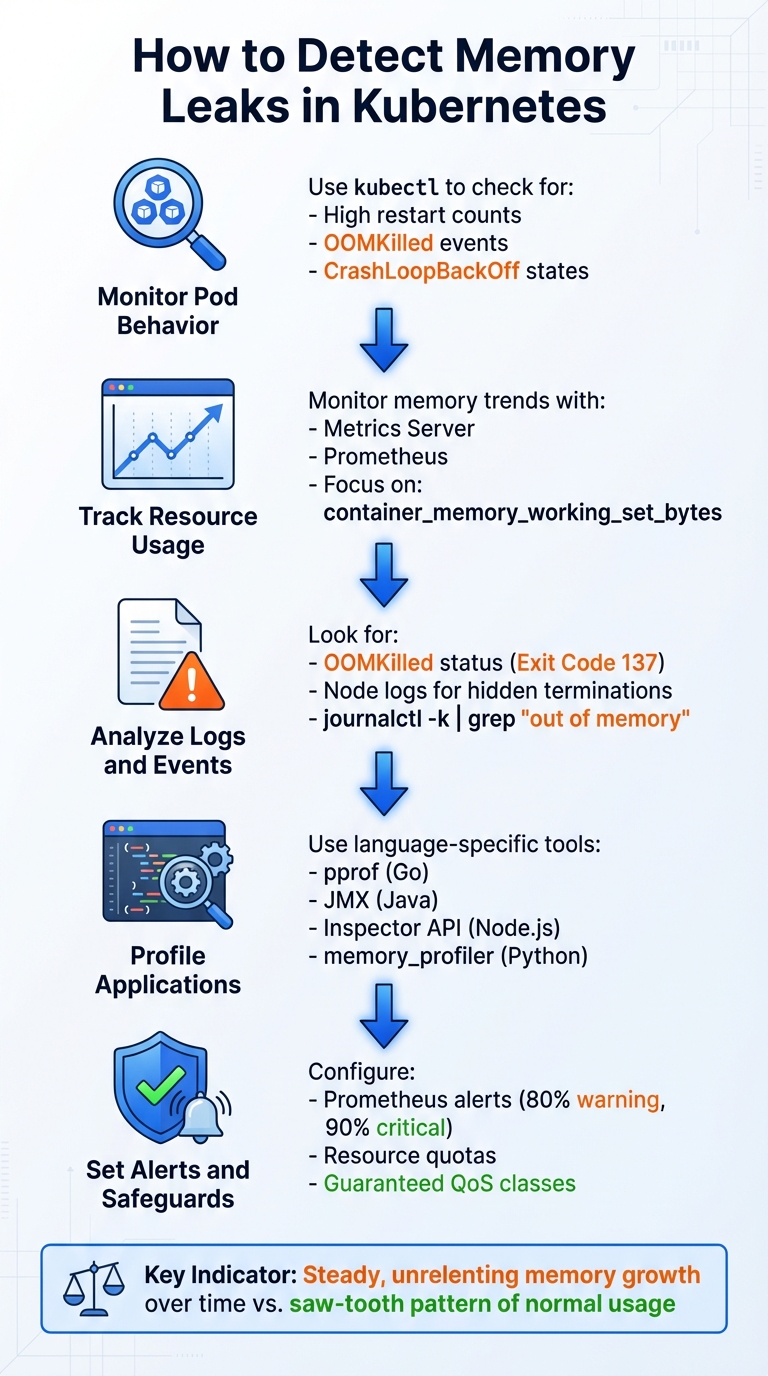
Key Steps to Detect Memory Leaks in Kubernetes:
- Monitor Pod Behavior: Use
kubectlto check for high restart counts, OOMKilled events, or CrashLoopBackOff states. - Track Resource Usage: Tools like Metrics Server and Prometheus help monitor memory trends over time, focusing on metrics like
container_memory_working_set_bytes. - Analyze Logs and Events: Look for OOMKilled statuses (Exit Code 137) and node logs for hidden memory terminations.
- Profile Applications: Use language-specific tools (e.g., pprof for Go, JMX for Java) to identify memory growth patterns at the application level.
- Set Alerts and Safeguards: Configure Prometheus alerts for memory thresholds and implement Kubernetes safeguards like resource quotas and Guaranteed QoS classes.
Detecting memory leaks involves observing steady, unrelenting memory growth over time. By combining monitoring tools, profiling techniques, and automated alerts, you can identify and address leaks before they disrupt your cluster.
5-Step Process to Detect Memory Leaks in Kubernetes Clusters
Identifying Memory Leak Symptoms in Kubernetes
Using Kubernetes Tools to Spot Symptoms
Start by running kubectl get pods to identify pods with unusual behavior, such as high restart counts or abnormal statuses like OOMKilled or CrashLoopBackOff. Once you spot a suspect pod, use kubectl describe pod [POD_NAME] to investigate further. Look for indicators like Reason: OOMKilled and an Exit Code: 137 in the "Last State" section.
For a broader view, kubectl get events can help you track memory-related terminations across the cluster. By applying field selectors, you can filter out irrelevant events. For instance:
kubectl get events --field-selector reason=Killing This command narrows down the list to pods terminated due to memory issues. However, in cgroup v1 environments, some memory terminations might go unnoticed, especially if a child process is killed while the main process keeps running. To uncover these hidden terminations, check the node logs using:
journalctl -k | grep -i "out of memory" This approach can reveal OOM (Out of Memory) events that don’t show up in Kubernetes events.
Once you’ve identified problematic pods, you can shift your focus to continuous monitoring with specialized tools.
Monitoring Memory Usage with Metrics Server
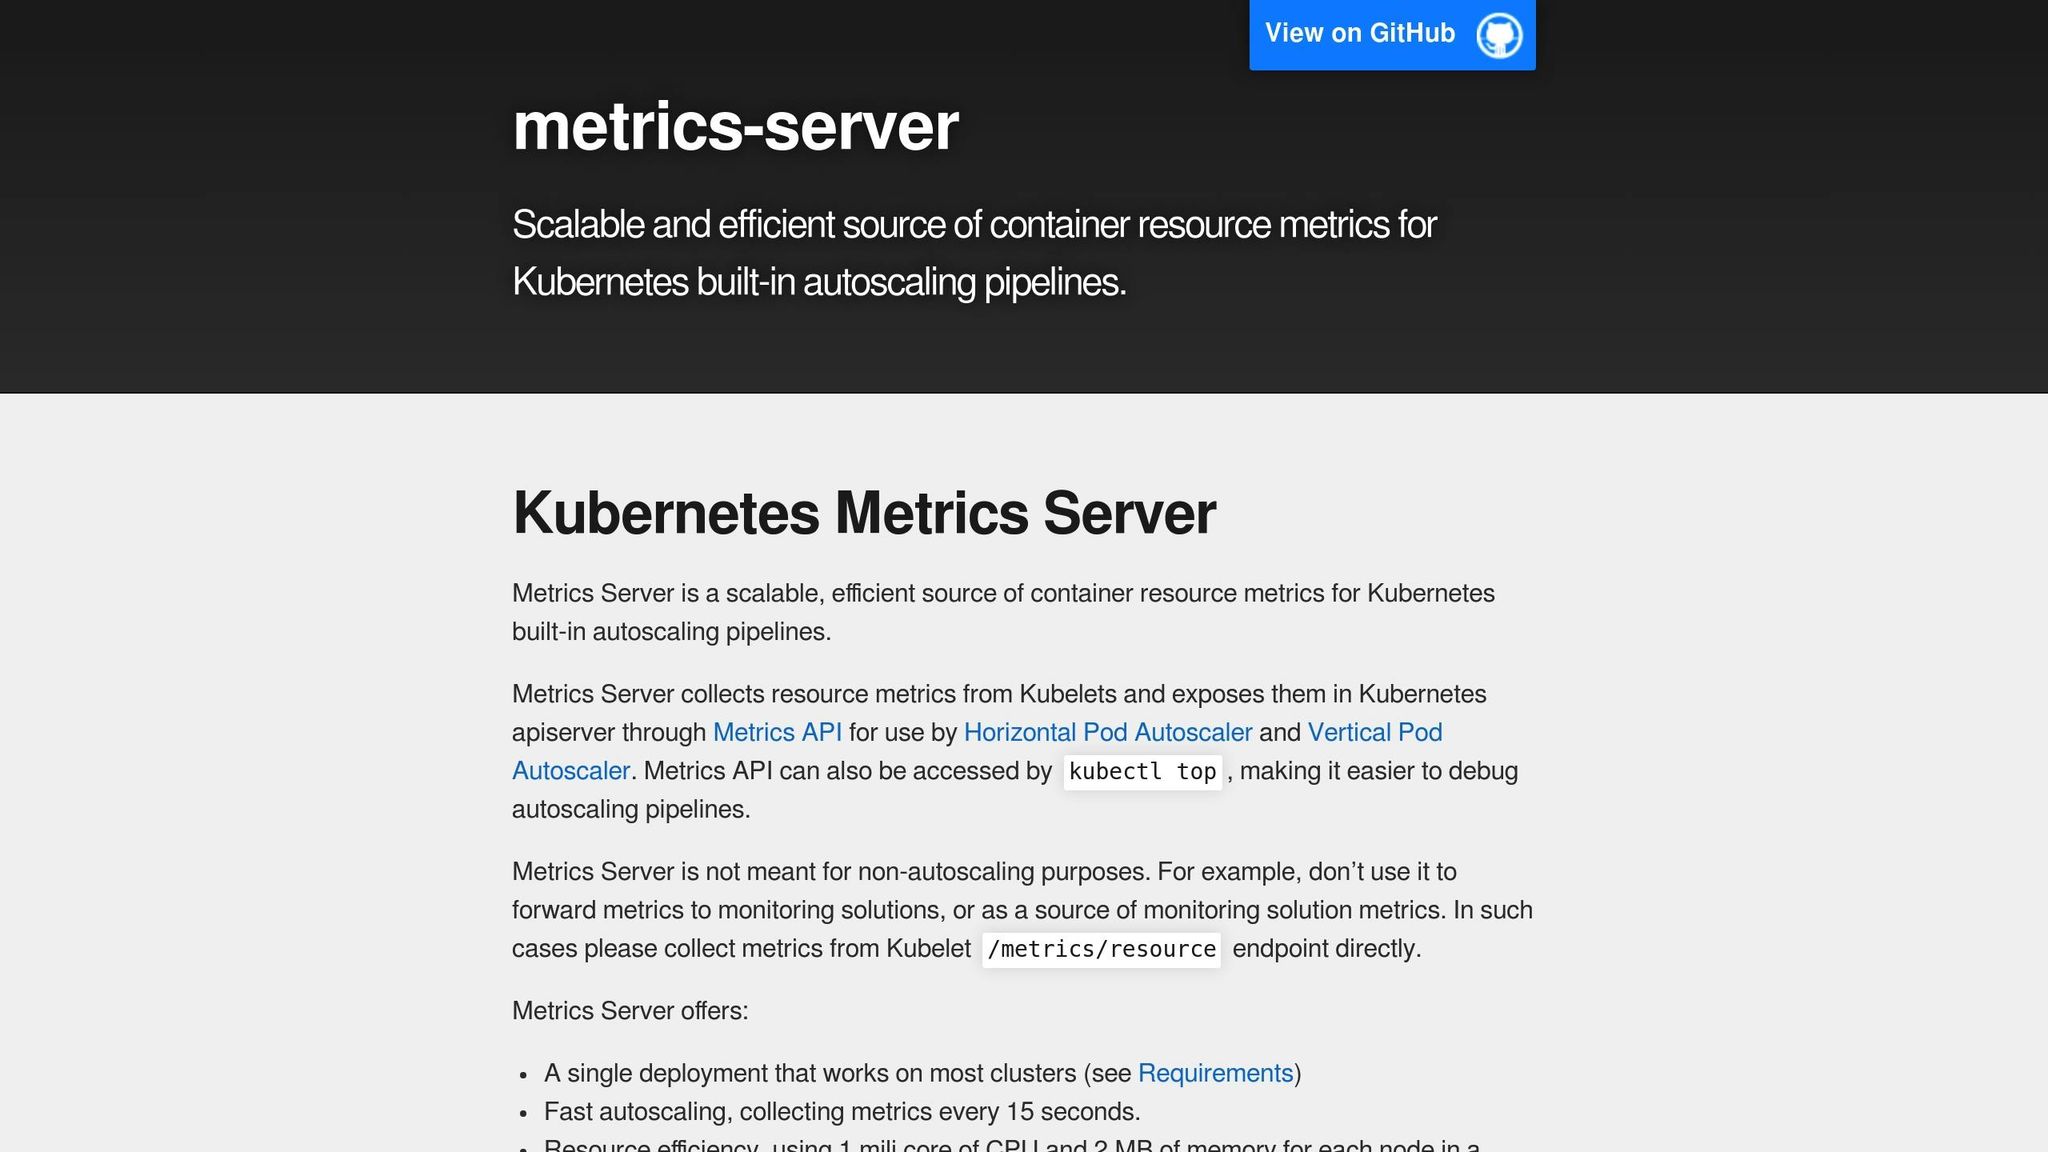
To keep tabs on memory usage over time, Metrics Server is your go-to tool. It collects CPU and memory data from kubelets and makes it accessible via the metrics.k8s.io API. With this, you can use kubectl top to get a snapshot of memory usage. For example:
- Run kubectl top pods –sort-by=memory to see which pods are consuming the most memory.
- Use kubectl top pod <pod-name> –watch to monitor memory usage in real time.
Metrics Server also provides insights into Working Set Memory, which represents the portion of memory that the kernel cannot reclaim without affecting the application. This metric is critical for assessing pod health.
To understand a pod’s eviction priority during memory pressure, you can check its Quality of Service (QoS) class with:
kubectl get pod <pod-name> -o jsonpath='{.status.qosClass}' Pods classified as BestEffort (those without resource requests or limits) are the first to be evicted, followed by Burstable pods. For a deeper dive into memory usage, you can execute commands directly within the pod and examine kernel-level data. Reading from:
/sys/fs/cgroup/memory/memory.usage_in_bytes gives you a precise view of how close the pod is to hitting its memory limit.
Separating Real Leaks from High Memory Usage
Distinguishing between a memory leak and normal high memory usage comes down to recognizing patterns over time. A memory leak typically shows a steady increase in memory usage that doesn’t return to baseline, even when traffic subsides. On the other hand, normal memory usage often forms a saw-tooth pattern, where memory climbs during activity but drops back to a consistent baseline afterward. Spikes in memory usage during traffic surges are temporary and usually subside as the load decreases.
"The working set is the subset of memory that can’t be reclaimed without application impact – the most important metric for pod health." – Anjali Udasi
In well-functioning pods, Working Set Memory generally remains between 60% and 80% of the set limit. If usage consistently exceeds 90%, the pod is at a high risk of termination. By comparing memory usage trends with traffic data, you can determine whether the issue stems from a memory leak or normal operations like caching or batch processing.
Cluster and Container-Level Memory Leak Detection
Baselining Memory Usage Over Time
To establish a reliable memory baseline, you’ll need to collect data for at least 1–2 weeks. This timeframe helps account for daily cycles and weekly traffic patterns, giving you an accurate picture of normal usage trends. One of the most dependable metrics for this task is container_memory_working_set_bytes. This metric measures memory that the kernel cannot reclaim under pressure, making it a strong indicator of potential memory leaks [5,7].
When setting resource requests and limits, aim for a practical approach. Use the 50th percentile (P50) of observed usage plus a 10–15% buffer for requests, and the 99th percentile (P99) plus a 20% buffer for limits. This strategy balances normal variability with protection against runaway memory usage.
A true memory leak reveals itself as a steady, unrelenting increase in memory usage, even during periods of low traffic. In contrast, normal memory usage will show predictable peaks and valleys tied to workload demands. To pinpoint issues, monitor memory baselines at three levels:
- Container level: Tracks isolated processes.
- Pod level: Aggregates memory usage across all containers in a pod.
- Node level: Measures physical host resource usage.
This multi-level monitoring helps distinguish between application-specific leaks and broader cluster-wide resource issues. Once a baseline is in place, you can use Prometheus to dive deeper into memory leak detection with targeted metrics.
Using Prometheus for Leak Detection
Prometheus takes memory monitoring to the next level by enabling detailed metric analysis. Focus on tracking container_memory_working_set_bytes rather than container_memory_usage_bytes, as the latter includes reclaimable page cache, which can add noise to your data [3,5,7]. For a closer look at application memory growth, monitor container_memory_rss. A steady, unbounded increase in this metric often points to a code-level memory leak.
To identify potential leaks, compare current memory usage to resource limits using kube_pod_container_resource_limits. If usage consistently exceeds 80–90% of the limit, it could indicate a leak or insufficient provisioning [5,12]. To differentiate between normal usage spikes and the gradual increase typical of a leak, apply PromQL functions like rate() or deriv() over a 1–6-hour interval [5,12]. For example, an alert based on deriv(container_memory_working_set_bytes[1h]) > 0 can help catch slow leaks before they lead to resource exhaustion.
Also, monitor kube_pod_container_status_last_terminated_reason{reason="OOMKilled"} to identify pods that have been terminated due to memory exhaustion [6,12]. It’s important to distinguish between container-level OOM kills (triggered by cgroup limits) and system-level OOM kills (caused by node-wide memory shortages). This distinction helps determine whether the issue is isolated to a specific application or affects the entire cluster [5,6].
Analyzing Logs and Events
Metrics alone may not capture every sign of a memory issue, so it’s essential to complement them with log analysis. One clear indicator is the OOMKilled status in a pod’s description, which is typically paired with Exit Code 137 [5,6]. However, in cgroup v1 environments, memory issues can sometimes go unnoticed. For example, if a child process is killed while the main process (PID 1) continues running, the pod won’t restart. These "invisible" OOM kills can be detected by searching node logs for terms like ‘TaskOOM’ or ‘ContainerDied’.
"An OOM kill is ‘invisible’ to Kubernetes if a child process is killed but the main container process continues to run (a common scenario in cgroup v1 environments)." – Google Cloud
To further investigate, use journalctl -k to analyze the node’s system journal. Look for container-level kills marked by memory cgroup or memcg tags. System-level kills, on the other hand, are often flagged by messages like Out of memory: Killed process [5,6]. Additionally, check for the MemoryPressure condition on nodes, which signals that the kubelet has detected low memory and may start evicting pods to stabilize the system [5,13].
In application logs, search for specific error messages like "out of memory", "Java heap space", or "Go panic." These messages can help you differentiate between external memory issues and internal application memory exhaustion [5,9]. By combining metrics and logs, you can piece together a clearer picture of the root cause of memory issues.
Application-Level Memory Profiling in Kubernetes
Runtime-Specific Profiling Techniques
After identifying a potential memory issue at the cluster level, the next step is to dig into the application itself. Each programming language provides tools to help you analyze memory usage and pinpoint problems.
For Go applications, you can use the net/http/pprof package. Start by importing it, then launch an HTTP server and link it to the pod’s profiling endpoint using kubectl port-forward. Run go tool pprof -http=:8081 http://localhost:8080/debug/pprof/heap to visualize memory allocation by function. For instance, one investigation found that failing to close HTTP response bodies caused memory to grow continuously. If the application crashes before you can profile it, alternative debugging methods may be necessary.
Node.js applications allow profiling without restarting the process. Use kubectl exec to send a SIGUSR1 signal to the Node.js process, enabling the Inspector API. Then, use kubectl port-forward to connect to the debugging port (commonly 9229) and access Chrome DevTools via chrome://inspect. A notable case involved the AJV library, where a migration issue caused JSON schemas to recompile on every request.
For Java applications, enable JMX remote management by adding -Dcom.sun.management.jmxremote to your JVM options. Use kubectl exec to run jmap inside the container and generate a heap dump file for analysis with tools like VisualVM. Python applications can leverage memory_profiler to attach to running processes and view memory usage line by line.
| Tool | Language | K8s Access Method | Primary Analysis View |
|---|---|---|---|
| pprof | Go | kubectl port-forward |
top, list, web (graph) |
| Inspector API | Node.js | SIGUSR1 + port-forward |
Chrome DevTools (Heap Snapshot) |
| VisualVM / JMX | Java | JMX Port + port-forward |
Heap Dump / MBeans |
| memory_profiler | Python | kubectl exec |
Line-by-line memory usage |
Using Debug Pods and Profiling Tools
Sometimes, profiling within your application isn’t enough, especially when working with minimal container images like "distroless." In such cases, debug pods can be a lifesaver. Kubernetes’ kubectl debug lets you inject an ephemeral container into a running pod without restarting it. By using the --target flag, you can share the process namespace with the application’s container, enabling interaction with its processes.
"The
kubectl debugcommand is extremely useful when you want to debug your application and you don’t have access to a shell or the tools that you need in your normal container." – Xenit Blog
For example, engineers used kubectl debug with a golang:1.15-alpine image to profile a Go application. They discovered that math/big.nat.make was responsible for 92.43% of memory allocations. Similarly, a Python development team found a memory leak in a FastAPI application using memray and debug containers. By attaching a debug container with --share-processes and --target, they identified that get_all_logs_from_given_time consumed 97.7% of memory. Refactoring the code to use StreamingResponse for incremental data delivery resolved the issue.
If a container crashes before profiling, you can use kubectl debug <pod-name> --copy-to=<new-pod-name> to create a replica with modified settings. For severe leaks that cause OOM (Out of Memory) errors before manual intervention, the Downward API can help. By passing the container’s memory limit as an environment variable, the application can monitor its usage and trigger a heap dump when it reaches a set threshold, like 80% of the limit.
Separating Application Leaks from Configuration Issues
Sometimes, what looks like a memory leak might actually be a configuration problem. It’s crucial to check resource configurations alongside code-level profiling to ensure you’re addressing the right issue.
Not all memory problems stem from the code. Misconfigured resource limits or garbage collection settings can also cause trouble. Running a load test that mimics production traffic can help. If memory usage remains stable during the test, the problem is likely related to configuration rather than a code-level leak.
"If a simulation that mirrors real-world usage does not cause a memory leak, you’re likely not testing the actual source of the leak." – Josh Thornton, Speedscale
To diagnose further, compare the Resident Set Size (RSS) to the "Live Memory Set" (memory left after garbage collection). A steady increase in the Live Memory Set points to an application-level leak, while high RSS with a stable Live Set suggests configuration issues or overly strict resource limits. For Go applications, monitor active goroutines. If memory grows but the goroutine count stays stable, the issue is likely in the heap. If both grow, it could indicate logic errors like unclosed routines.
The SRE team at Trendyol encountered a persistent memory issue that caused nodes to run out of memory. Although pod memory requests were set at around 64MB, actual usage reached 256MB. After upgrading containerd and profiling the application, they traced the problem to a single line of Go code that printed the entire OpenTelemetry context for every request. Removing this line freed up as much as 40GB of memory across high-traffic apps.
A sawtooth pattern in memory usage usually indicates healthy garbage collection, while a steady ramp-up that hits the limit suggests a leak. If there’s a large gap between requested resources and actual usage, it might lead to node imbalances and OOM kills, even without a code-level leak. This highlights the importance of fine-tuning resource requests.
sbb-itb-f9e5962
Automating Memory Leak Detection and Remediation
Setting Up Alerts for Memory Leaks
Once manual monitoring confirms potential memory leaks, scaling up with automated alerts and remediation becomes a necessity. Manual methods just can’t keep up. To prevent pod crashes, configure Prometheus alerts. Start with threshold-based alerts: set them to trigger warnings when memory usage hits 80% of the defined limit and escalate to critical when it reaches 90%. However, basic thresholds may miss slow, creeping leaks that consume memory over days or weeks.
To catch these gradual increases, use the deriv() function in PromQL, which identifies steady growth trends signaling memory consumption issues. Additionally, monitor kube_pod_container_status_last_terminated_reason{reason="OOMKilled"} for real-time notifications of pods terminated due to memory exhaustion. Keep an eye on pod restart counts, as repeated CrashLoopBackOff errors often point to recurring leaks.
Here’s an example: In late 2023, Robert Wunderer from CapriSys GmbH dealt with backend failures in a multi-tenant e-commerce system after a version update. Using Dynatrace to track Kubernetes events, his team discovered a surge in OOMKilled events on the report service pod. Memory usage steadily climbed to the 400MB limit before crashing. Their solution? Increasing the limit to 600MB and implementing rigorous memory testing in their staging environment.
Implementing Auto-Remediation Patterns
Restarting a pod can clear memory issues but wipes out valuable diagnostic data in the process. A smarter approach captures this data before restarting. For example, in July 2023, Vikas Yadav from KubeNine created an automated workflow using Robusta and Prometheus. He simulated a Python memory leak that added 100KB every second and set up a PrometheusRule to trigger at 80% of the 128MB memory limit. Robusta’s playbook automatically captured ps aux output and pod logs before deleting the pod for a graceful restart. All diagnostic details were sent to Slack, allowing the team to debug without resorting to a hard OOM kill.
Automating remediation in this way – capturing logs, notifying teams, and restarting pods gracefully – provides developers with the necessary data to address root causes instead of merely patching symptoms. To buy additional time, configure a Horizontal Pod Autoscaler (HPA) to scale out replicas when average memory usage hits 80%, preventing pods from exhausting their limits too quickly.
Once these patterns are in place, the next step is setting up Kubernetes safeguards to minimize disruption.
Configuring Kubernetes Safeguards
In production environments, set memory requests equal to limits. This ensures pods are classified under the Guaranteed QoS tier, making them the last to be evicted during node memory pressure. To enforce consistent memory settings across all containers in a namespace, use LimitRange, and apply ResourceQuota to cap total memory consumption within a namespace.
"Setting a limit and a request creates a range of memory that the pod could consume, making it easier for both you and Kubernetes to determine how much memory the pod will use on deployment." – Andre Newman, Sr. Reliability Specialist, Gremlin
To maintain stability during automated restarts triggered by leak detection, configure PodDisruptionBudgets to ensure a minimum number of pods remain running. Additionally, use the Vertical Pod Autoscaler (VPA) in recommendation mode to analyze actual memory usage patterns. This helps fine-tune your resource requests based on real-world data rather than guesswork.
These safeguards tie together your automated alerting and remediation workflows, creating a robust system to continuously protect against memory leaks.
Kubernetes OOMKilled: Fix Memory Limit Issues & Exit Code 137 | K8s Troubleshooting Tutorial
Conclusion
Memory leaks in Kubernetes can severely impact cluster performance, leading to inefficiencies and even cascading failures. Detecting these issues early is essential to prevent Out of Memory (OOM) terminations, avoid costly CrashLoopBackOff states, and ensure accurate memory allocation for requests and limits.
To tackle memory leaks effectively, you can rely on a combination of tools: use kubectl top for quick, real-time insights, leverage Prometheus to identify dynamic patterns, and employ runtime-specific profiling tools for deeper, granular analysis. Together, these tools provide a solid foundation for building automated monitoring and remediation strategies.
A crucial metric to monitor is Working Set Memory, which represents the unreclaimable memory that often triggers OOM events.
"Assigning memory resources to pods and containers is both a science and an art", says Robert Wunderer, Founder of CapriSys GmbH.
By summarizing detection methods, you can pave the way for automation to address memory leaks more efficiently. Automation transforms reactive responses into proactive, stable operations. For example, setting memory requests equal to limits ensures pods fall under the Guaranteed QoS class, protecting them from sudden evictions during memory pressure. Additionally, configuring Prometheus alerts for early warnings and establishing 1–2 week baselines helps capture real traffic patterns and identify anomalies.
Incorporating these strategies into your Kubernetes workflows can significantly reduce downtime, cut costs, and speed up root cause analysis. Automation and proactive monitoring are investments that pay off in improved cluster stability and operational efficiency.
FAQs
How can I tell if a pod in Kubernetes has a memory leak or just high memory usage?
A memory leak happens when a pod’s RAM usage keeps climbing without any decrease, ultimately causing an out-of-memory (OOM) kill. On the other hand, high memory usage refers to temporary spikes in RAM consumption that stabilize or drop after workload changes or garbage collection.
The key to telling them apart is to track memory usage patterns over time. Memory leaks show a steady, unrelenting increase, while high memory usage tends to rise and fall in response to shifting workloads.
What tools can help profile memory usage for specific programming languages in Kubernetes?
To assess memory usage for a specific programming language in a Kubernetes setup, combining language-specific profiling tools with Kubernetes-aware observability platforms can yield precise results.
- Go: Take advantage of the
pproftoolchain that comes built-in. Expose the/debug/pprof/heapendpoint in your container to capture heap snapshots. Then, usego tool pprofto interactively analyze these snapshots and pinpoint significant memory allocations. - Node.js: Utilize Chrome DevTools’ Memory panel during a remote debugging session. This allows you to capture heap snapshots and track allocation timelines, helping you identify objects holding memory and uncover potential leaks.
In environments running multiple languages, tools like Datadog’s Continuous Profiler offer live memory insights across different languages, services, and pods. These tools provide both detailed process-level data and a broader view of the entire cluster. By combining these methods, you can effectively detect and address memory leaks in Kubernetes.
How can I automatically detect and resolve memory leaks in Kubernetes clusters?
To keep memory leaks in Kubernetes under control, you can automate their detection and resolution with a simple workflow. Start by deploying a lightweight metrics server or a Prometheus stack to monitor real-time memory usage across your pods. Configure Prometheus to send alerts when a pod’s memory usage stays above a specific threshold – say 80% of its limit – for an extended period. This consistent spike can indicate a potential memory leak.
Next, use Alertmanager to handle these alerts. You can route them to a webhook that triggers automated remediation actions, like restarting the problematic pod or rolling out an updated deployment. This setup ensures your application bounces back without requiring manual intervention. For added visibility, you can integrate notifications with tools like Slack, so your team stays in the loop.
Don’t forget to periodically review and adjust your thresholds and alert configurations. This helps reduce false alarms and keeps your Kubernetes clusters running smoothly with minimal disruptions.