Egress Pricing by Region: How to Build a Cost Map

Egress fees, the charges for transferring data out of cloud providers’ networks, can make up 20–40% of your cloud expenses. These costs vary widely by region, with Asia-Pacific, South America, and Africa often being more expensive than North America and Europe. For example, AWS and Azure charge around $0.09/GB for the first 10 TB in U.S. regions, while GCP‘s Premium Tier starts at $0.12 per GiB. Hidden fees, like inter-region transfers or NAT Gateway usage, can further inflate your bill.
To manage these costs, you can create a cost map – a visual tool that tracks data transfer paths and highlights expensive patterns. By colocating resources, minimizing inter-region traffic, and using compression, you can cut costs. Alternatively, bare metal providers like TechVZero eliminate egress fees entirely, offering significant savings for data-heavy workloads.
Key Takeaways:
- Egress fees vary by region: Costs in Asia-Pacific can be 127× higher than the cheapest regions.
- Hidden charges add up: Inter-AZ transfers, NAT Gateway fees, and cross-region transfers can quietly increase expenses.
- Cost maps help optimize: Identify costly transfer paths and reduce unnecessary data movement.
- TechVZero alternative: Bare metal solutions can eliminate egress fees entirely for substantial savings.
This guide explains how to analyze egress pricing, build a cost map, and reduce cloud expenses effectively.
Reducing cloud egress charges: 10 common pitfalls and how to avoid them [Cloud Masters #121]
sbb-itb-f9e5962
Regional Egress Pricing for AWS, Azure, and GCP
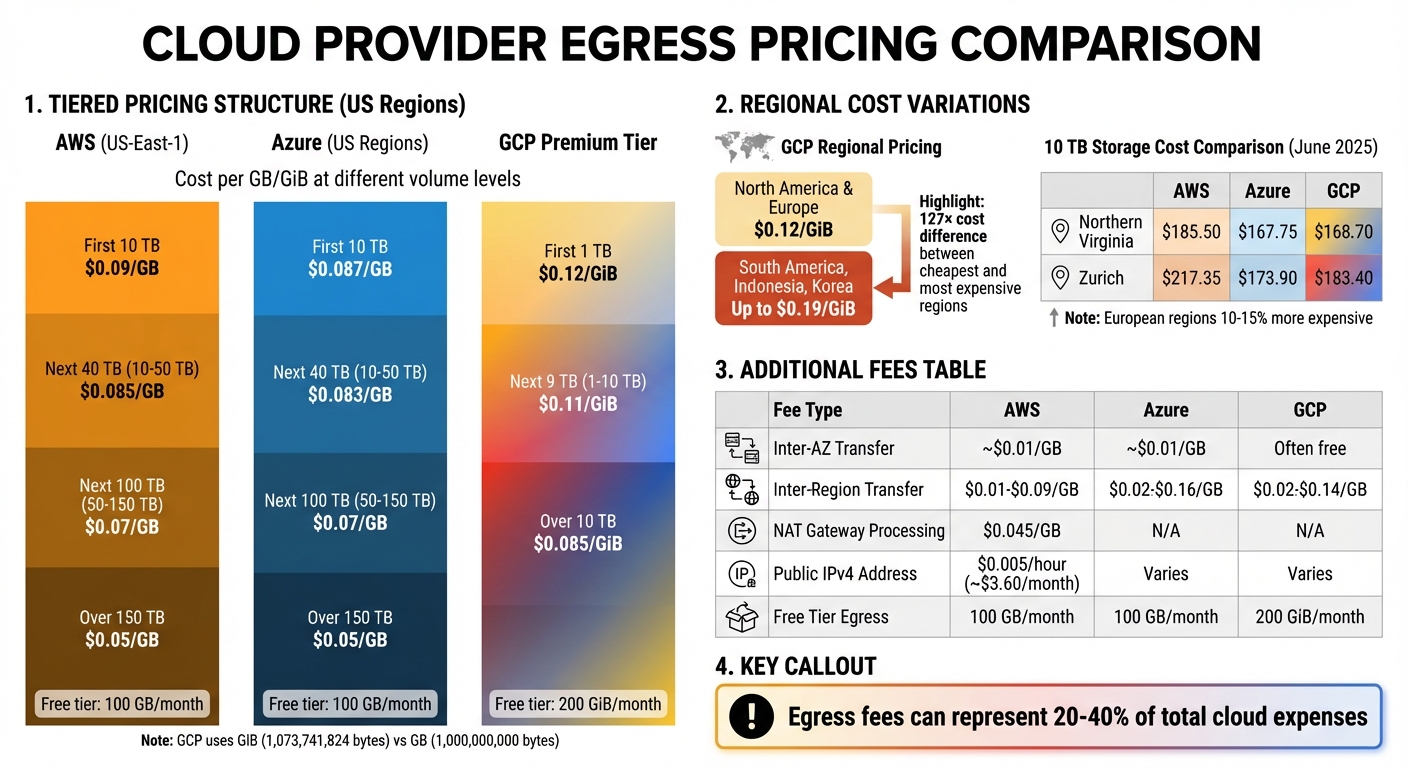
Cloud Provider Egress Pricing Comparison: AWS vs Azure vs GCP by Region and Tier
AWS, Azure, and GCP each have their own approaches to pricing data egress, which can significantly impact costs. AWS uses a tiered model where the per-GB cost decreases as the monthly transfer volume increases. Azure maintains competitive internet egress rates but applies notable "Zone Taxes" for inter-AZ data transfers. GCP, on the other hand, offers a Network Service Tier approach: its Premium Tier routes traffic over a private fiber backbone for lower latency, while the Standard Tier relies on the public internet at a reduced cost . Below, we break down pricing tiers, regional differences, and extra fees associated with these providers.
Pricing Tiers by Provider
Each provider offers a free egress tier: AWS and Azure provide 100 GB per month, while GCP allows around 200 GiB per month. Beyond these free tiers, costs follow tiered pricing structures based on monthly usage. In U.S. regions like US-East-1, AWS charges $0.09/GB for the first 10 TB, $0.085/GB for the next 40 TB, $0.07/GB for volumes between 50–150 TB, and $0.05/GB for anything beyond 150 TB. Azure’s rates are slightly lower, starting at $0.087/GB for the first 10 TB, dropping to $0.083/GB for 10–50 TB, and aligning with AWS at $0.07/GB for 50–150 TB, before also reaching $0.05/GB above 150 TB.
GCP’s Premium Tier begins at $0.12 per GiB for the first 1 TB, decreases to $0.11 per GiB for 1–10 TB, and drops further to $0.085 per GiB for usage above 10 TB. Note that GCP uses GiB (1,073,741,824 bytes) instead of the decimal GB used by AWS and Azure, meaning you’re billed for slightly more data per unit. These pricing models highlight how costs scale and set the stage for regional variations.
Regional Cost Comparison
Data egress costs can vary widely depending on the region. North America and Europe generally have the lowest rates, while areas like Asia-Pacific, South America, and Africa often face higher charges. For example, GCP charges $0.12 per GiB for egress from North America and Europe but up to $0.19 per GiB for regions like South America or countries such as Indonesia and Korea.
A June 2025 analysis by Hokstad Consulting revealed that storing 10 TB in Northern Virginia cost approximately $185.50 on AWS, $167.75 on Azure, and $168.70 on GCP. In Zurich, the same 10 TB cost $217.35 on AWS, $173.90 on Azure, and $183.40 on GCP. Additionally, European regions like London can be 10–15% more expensive for compute, and selecting the right region can reduce cloud costs by as much as 40%.
Additional Fees to Consider
Several additional charges can influence your overall bill beyond standard internet egress. Inter-AZ transfers, for example, cost around $0.01/GB per direction on AWS and Azure, adding up to $0.02/GB for a round trip. These costs can rival internet egress fees for high-availability setups. Inter-region transfer costs vary by provider and location: AWS charges between $0.01 and $0.09/GB, Azure ranges from $0.02 to $0.16/GB, and GCP charges $0.02 to $0.14/GB depending on the source and destination .
AWS also imposes fees for NAT Gateway usage, charging ~$0.045/GB for traffic moving from private subnets to the internet. Additionally, starting in 2024, AWS will charge $0.005 per hour (approximately $3.60 per month) for each public IPv4 address, regardless of data usage. Azure offers routing options to reduce costs: its "ISP Routing" sends traffic to the public internet quickly, while routing through the Microsoft Global Network incurs higher charges. Understanding these nuanced fees can help optimize your regional egress strategy.
| Fee Type | AWS | Azure | GCP |
|---|---|---|---|
| Inter-AZ Transfer | ~$0.01/GB | ~$0.01/GB | Often free for same-zone |
| Inter-Region Transfer | $0.01–$0.09/GB | $0.02–$0.16/GB | $0.02–$0.14/GB |
| NAT Gateway Processing | $0.045/GB | N/A | N/A |
| Public IPv4 Address | $0.005/hour | Varies | Varies |
| Free Tier Egress | 100 GB/month | 100 GB/month | 200 GiB/month |
How to Build a Cost Map
To transform raw pricing data into a visual representation of egress costs, you’ll need to create a cost map. This involves three key steps: gathering regional pricing data from provider tools, organizing the data using Python and Pandas, and generating visual comparisons to highlight cost differences across regions and providers.
Collecting Regional Pricing Data
The first step is identifying your four transfer boundaries: Internet egress (to end users), Cross-region (replication/disaster recovery), Cross-AZ (service-to-service traffic), and CDN origin (cache fill). Each type has its own pricing structure, so combining them into an average could lead to inaccuracies in your cost map.
Start by pulling usage metrics from VPC and CDN logs, as well as cloud billing exports. Use pricing calculators from providers to determine effective rates. For AWS, you can run the command aws ce get-cost-and-usage with filters like USAGE_TYPE_GROUP (e.g., "EC2: Data Transfer – Inter AZ") to retrieve detailed historical costs.
Keep an eye out for hidden fees that might not be obvious in standard pricing. For example, AWS NAT Gateway processing adds $0.045/GB, and Load Balancer data processing fees can quietly inflate your bill. To avoid errors, ensure all units are standardized during this process.
Once you’ve collected the data, it’s time to structure it for analysis using Python and Pandas.
Organizing Data with Python and Pandas
In this step, organize your data into a Pandas DataFrame with columns like Provider, Region, Traffic_Type (e.g., Internet, Cross-Region, Cross-AZ, or CDN), Tier_Start_GB, and Price_per_GB. This structure lets you analyze how costs change as traffic scales across pricing tiers.
Use the AWS Price List Bulk API to pull pricing details for different services and regions. Within Pandas, break down the data into separate entries for each transfer type, as pricing per GB can vary significantly. Be sure to model both baseline and peak traffic scenarios to account for potential spikes.
Apply the provider’s tiered pricing logic to calculate effective blended rates. Your Python script should assign the correct pricing tier to each volume slice, ensuring accuracy. Compare these calculations with actual monthly billing exports for validation.
With your data now structured and analyzed, you can move on to creating visual comparisons.
Creating Visual Cost Comparisons
Using your organized data in Pandas, leverage Matplotlib to create visualizations. Heatmaps are great for showing regional price differences, while bar charts can illustrate overall costs, including both egress and storage, across providers.
A normalized price index can also be helpful. For example, set a baseline region like us-east-1 at 100, then compare other regions against this benchmark.
For instance, if you’re visualizing 50 TB of monthly egress from Northern Virginia, you might see AWS costing about $4,300, Azure at $4,190, and GCP at $5,600, reflecting their respective pricing tiers. Use these visuals to compare both per-GB rates and total monthly costs, making it easier to identify the most cost-effective regions for your traffic needs.
Reducing Egress Costs with TechVZero Bare Metal
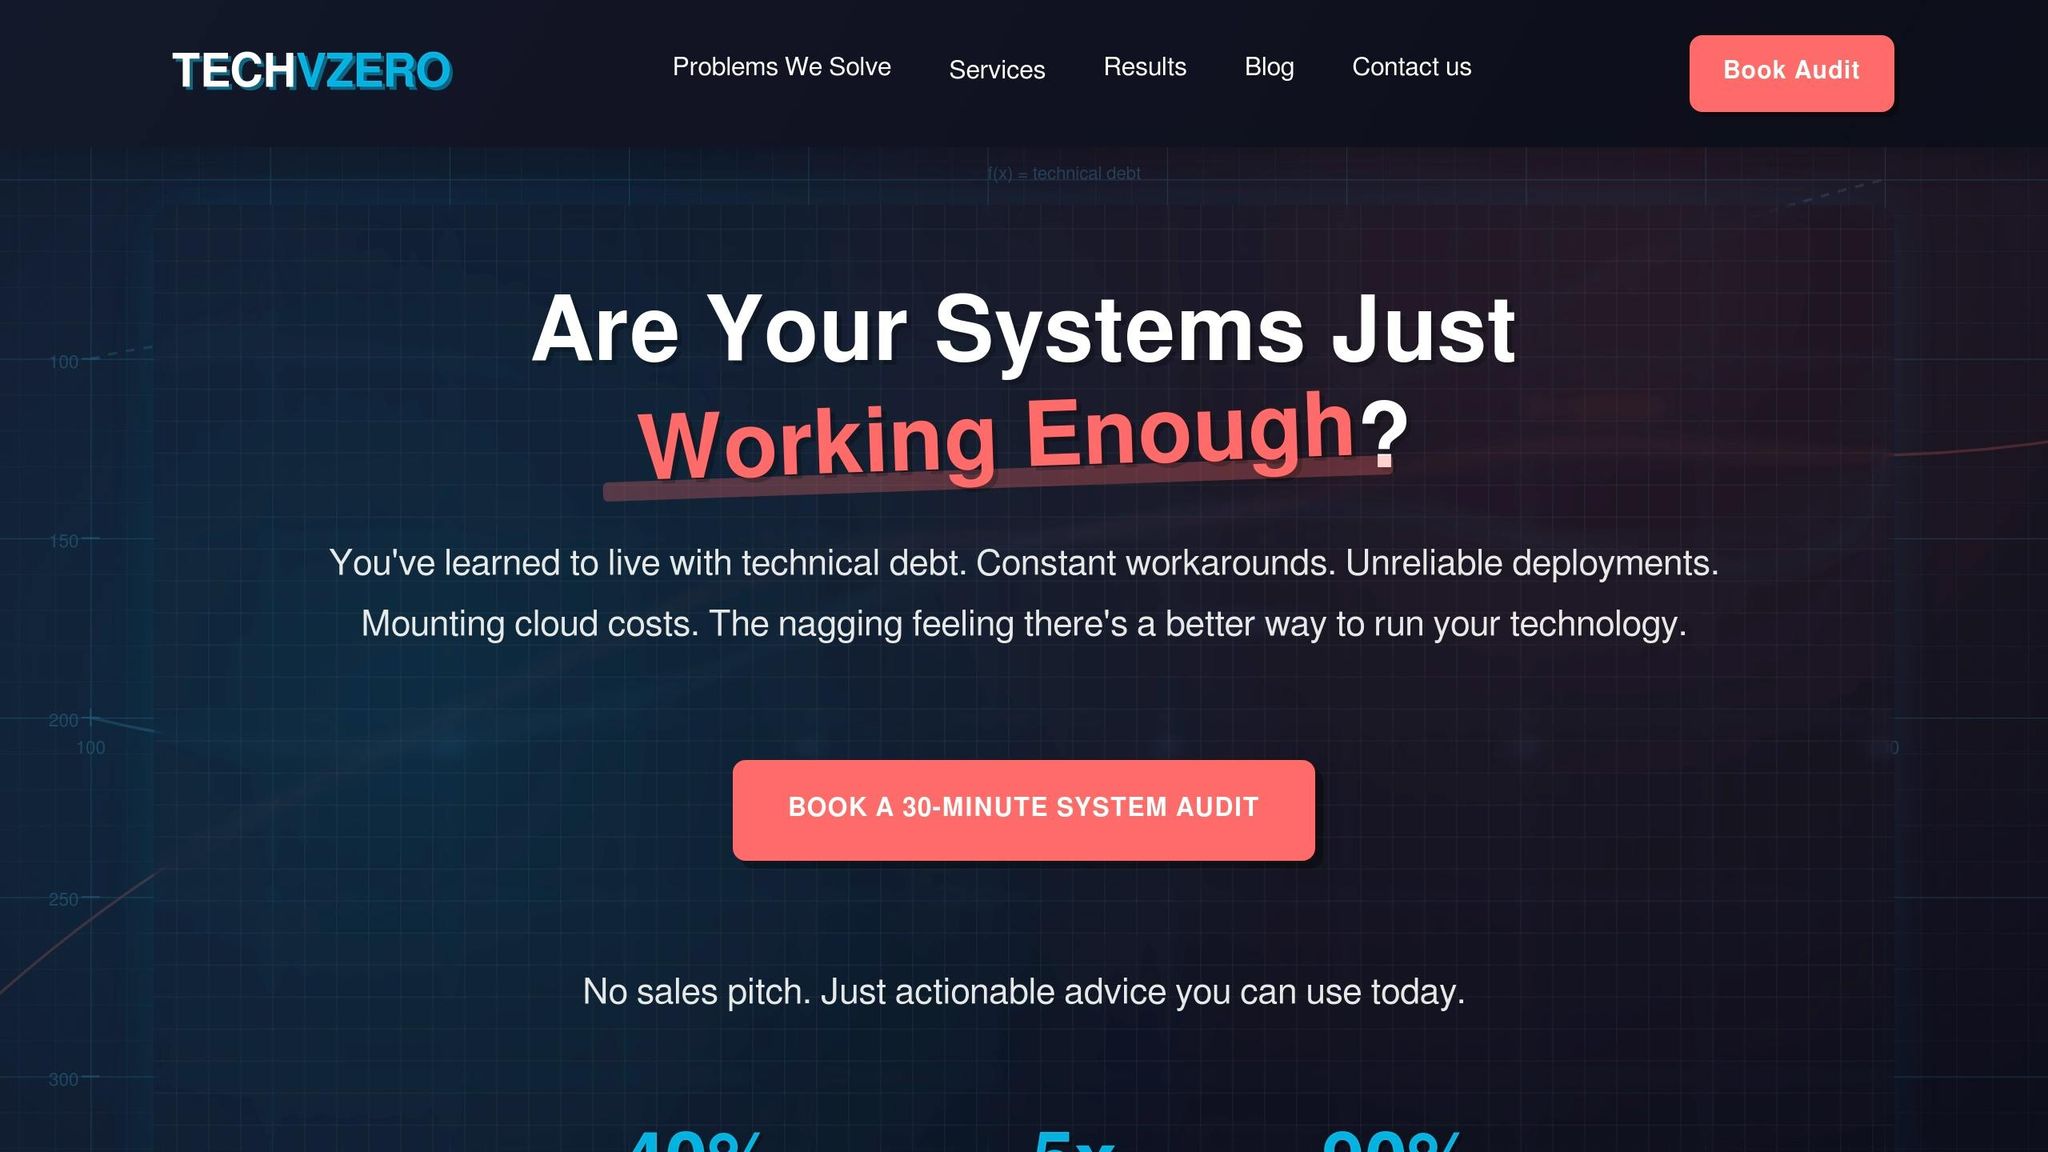
Eliminating Egress Fees with Bare Metal Kubernetes
If you’re analyzing your cost map, one issue likely stands out: hyperscalers let data flow in for free but charge hefty egress fees – anywhere from $0.05 to $0.23 per GB. This pricing model creates a revenue stream for them but acts as a financial roadblock for companies aiming to cut costs or shift workloads.
TechVZero’s bare metal Kubernetes infrastructure removes this obstacle entirely. Unlike hyperscalers, which inflate IP transit fees for profit, bare metal providers absorb those costs, offering free, unlimited outbound data transfer. This means you get the same reliability – TechVZero operates at scales exceeding 99,000 nodes – but without the "egress tax" that can eat up 20–40% of your total cloud spending. By addressing this pain point, TechVZero directly aligns with your cost map insights, turning outbound transfer fees into tangible savings.
Using Your Cost Map to Calculate Savings
Your cost map is a powerful tool for identifying savings opportunities, especially for workloads with heavy egress usage. Start by focusing on high-volume data consumers like AI and ML applications. These workloads are notorious for generating large datasets and model checkpoints, often ranging from 10 to 50 GB each. Check the "Internet egress" and "Cross-region" categories on your map – areas where hyperscalers typically charge around $90 per TB. On bare metal, those charges drop to $0 per TB.
For example, if your cost map shows significant monthly egress volumes on hyperscalers, migrating those workloads to TechVZero could eliminate those fees entirely.
Cost Reduction Example
Real-world migrations showcase just how much can be saved. Take Basecamp‘s 2023 move off AWS and Google Cloud: they spent about $600,000 on hardware and transitioned to bare metal. This shift slashed their expenses by $1 million annually, including $5,000 per day in S3-related costs, and they projected $10 million in savings over five years. Similarly, Dropbox‘s migration from AWS S3 to its own infrastructure in 2015–2016 saved the company $74.6 million in just two years, with $39.5 million saved in the first year alone.
"The difference between free and $90/TB doesn’t matter when you’re moving a few gigs. It matters a lot when you’re training models and shuffling terabytes between services."
- Faiz, Founder of GPUPerHour
TechVZero operates on a performance-based model: you pay 25% of your savings for one year, and nothing if they don’t hit the agreed savings floor. For instance, one client saved $333,000 in a single month while TechVZero simultaneously mitigated a DDoS attack during the same engagement. By leveraging your cost map, you can establish a clear baseline – compare your current hyperscaler egress costs to zero and include any additional fees you’ve identified. The potential savings could redefine your budget priorities.
Strategies to Reduce Egress Expenses
Selecting Regions with Lower Egress Costs
If you take a close look at cloud provider pricing, you’ll notice a trend: data transfers to regions like Asia-Pacific, South America, and Africa are far pricier than transfers to North America or Europe. By consolidating workloads in regions like US East (N. Virginia), where egress fees are lower, you can significantly cut costs. For example, AWS charges outbound transfer fees based on the source region, so hosting primary workloads in these cost-effective zones ensures that every gigabyte leaving your infrastructure is cheaper.
Google Cloud Platform users can save money by switching from the default "Premium Tier" (which uses Google’s private network) to the "Standard Tier" (which routes over the public internet). This change reduces costs but may introduce a bit more latency. Azure users should watch out for the "Zone Tax" – a $0.01/GB fee for data transfers between Availability Zones within the same region. This charge can rival internet egress costs when running high-availability clusters. For non-critical workloads like development or staging, colocating servers within the same zone can help avoid these fees.
Once your regional setup is optimized, the next step is to minimize inter-region data transfers.
Reducing Data Transfers Between Regions
Cutting down on inter-region data movement is one of the most effective ways to lower egress expenses. The simplest solution? Keep related services within the same region. For instance, grouping application servers and their databases together eliminates unnecessary communication costs. When cross-region transfers are unavoidable, techniques like delta replication and compression (e.g., Gzip) can reduce data volume by 30% to 60%.
A great real-world example comes from PayU Hub‘s payments engineering team. In January 2025, they slashed their AWS data transfer costs by 50% with three focused changes: increasing Prometheus scrape intervals from 15 to 30 seconds for non-production environments, removing high-cardinality Istio metrics, and redesigning their Intrusion Detection System to stop cross-AZ traffic caused by a central Network Load Balancer. Similarly, an AWS Real-Time Bidding case study showed how optimizing log collection paths saved big. By replacing a setup that transferred logs from us-west-2 to a us-east-1 S3 bucket via a NAT Gateway with VPC peering and S3 interface endpoints, they reduced monthly costs for 300 TB of logs from $17,700 to $6,300 – a 64% savings.
Other cost-saving strategies include using VPC Gateway Endpoints for services like S3 and DynamoDB, which eliminate extra egress fees. Additionally, for content delivery, placing a CDN like CloudFront in front of S3 can be more economical. Origin fetches from S3 to CloudFront are free, and CloudFront egress rates are often cheaper than direct S3 egress. For example, serving 2 TB of data directly from S3 costs roughly $180/month, but using CloudFront drops that to about $85/month.
Long-Term Savings with TechVZero
By combining regional and transfer optimization strategies, you can make a dent in your egress costs – potentially reducing them by 20–40%. That said, the "egress tax" still remains. This is where TechVZero offers a game-changing solution. Their bare metal Kubernetes platform eliminates outbound traffic charges entirely, turning what was once a recurring cost into a one-time negotiation.
TechVZero operates on a performance-based pricing model: you pay only 25% of your savings for one year, and nothing if they don’t meet the agreed savings threshold. For data-intensive workloads like analytics pipelines, content delivery, or AI model training – where egress fees often account for 10–30% of total cloud expenses – this approach can result in substantial savings. With TechVZero, your cost map becomes a tool to compare your current egress expenses to zero, allowing you to see the impact of these savings over a 12-month period.
Conclusion
Key Takeaways
Your cost map has unveiled the hidden factors driving your cloud expenses. For instance, egress fees – often overlooked – can quietly inflate your cloud bill by 10–30%, only becoming apparent when the invoice arrives. By creating a cost map, you gain a clear picture of where every dollar goes, turning those hidden fees into actionable insights.
Understanding regional cost variations is another game-changer. Transfers to Asia-Pacific, for example, can cost significantly more than those to North America. Armed with this knowledge, you can design systems that avoid these costly pitfalls right from the planning stage. Essentially, your cost map becomes a guide for building more cost-efficient infrastructure.
Consider this: there’s a staggering 127× cost difference between the cheapest and most expensive egress options. While strategies like using VPC endpoints, compressing data, or leveraging CDNs can help reduce these costs, the "egress tax" often remains a persistent issue. That’s where TechVZero’s bare metal Kubernetes platform comes in – it eliminates egress fees entirely. Instead of dealing with recurring egress costs, your cost map shifts to compare your current charges with $0.00.
TechVZero operates on a performance-based model: you pay 25% of your savings for one year, and nothing if they don’t meet the agreed threshold. For data-heavy workloads like analytics, content delivery, or AI training, this approach removes a recurring expense, exposing the real cost of traditional cloud models.
With these insights, you can make smarter architectural decisions that eliminate egress charges altogether. Your cost map doesn’t just track expenses – it empowers you to redefine them, transforming recurring fees into opportunities for long-term savings.
FAQs
What’s the fastest way to estimate my blended egress rate by region?
The fastest method is to use a cloud data egress cost calculator. Simply input your data transfer volumes and regional traffic patterns, and it will estimate costs for you.
Another option is to dig into your billing exports, flow logs, or throughput metrics to analyze current data transfer. Once you have those numbers, apply the regional rates to estimate expenses.
For a more detailed approach, tools like AWS Cost Explorer can help you monitor actual data transfer patterns. Multiply those observed volumes by the regional rates to calculate your blended egress rate with greater accuracy.
Which data transfer fees are most often missed in cloud bills?
When it comes to cloud bills, one of the most frequently missed costs is tied to egress charges – fees for outbound data transfers. These charges often include data moving between regions or across different Availability Zones (AZs). If left unchecked, they can quietly add up and inflate your expenses. Keeping a close eye on these charges is crucial to sidestep surprises and better manage your cloud budget.
What should I include in a cost map to make it accurate?
When analyzing egress pricing, it’s important to consider regional variations and associated costs. Take the time to map out specific data transfer regions and clearly differentiate between transfer types – such as transfers via the public internet, cross-region transfers, or inter-AZ (Availability Zone) transfers.
Don’t overlook potential hidden fees, like those associated with NAT gateways, which can inflate costs unexpectedly. To stay on top of expenses, leverage monitoring tools that track costs in real time and allow you to compare pricing data across different providers. These tools can help you visualize pricing differences and pinpoint areas where you can cut expenses more effectively.