Anomaly Detection for Spend: From Alerts to Actions

Cloud costs can spiral out of control fast – 27% of cloud spending is typically wasted, and cost anomalies can inflate monthly bills by up to 200%. The real problem? Traditional alerts are too slow and static, often missing the difference between healthy growth and misconfigurations. By the time you notice, the damage is done.
Here’s the fix: smarter, real-time anomaly detection systems. These tools create dynamic baselines, flag unusual patterns, and cut detection time from days to under an hour. They also automate responses, such as capping resources or alerting the right team, turning cost management into a self-regulating process.
Key Takeaways:
- Why it matters: AI and SaaS workloads are unpredictable, and cloud billing delays make catching anomalies harder.
- How it works: Statistical models analyze trends, detect anomalies, and account for growth and seasonality.
- What to do: Set dynamic thresholds, tailor alerts by team/project, and automate responses to stop overspending immediately.
The goal? Stop wasting money on cloud resources, fix issues faster, and make cost management efficient.
Cloud Cost Anomaly Detection in Kubernetes | Detect & Alert on Sudden Usage Spikes
sbb-itb-f9e5962
How Anomaly Detection Works for Cloud Costs
Anomaly detection systems are designed to monitor cloud spending by analyzing real-time cost and usage data. Unlike basic budget alerts that rely on fixed thresholds, these systems create a dynamic and adaptive "living baseline." This baseline evolves with your infrastructure’s behavior, whether you’re managing Kubernetes clusters, serverless functions, or GPU-heavy AI workloads. Techniques like Z-score analysis, exponential moving averages, and advanced time series models allow these systems to identify trends and account for seasonal changes. They work across multiple levels, from individual SKUs to entire projects, ensuring a comprehensive view of spending patterns. Let’s dive into how these systems establish baselines, classify anomalies, and handle seasonality.
Setting Spending Baselines
The first step in anomaly detection is establishing a reliable baseline using historical data – typically around 14 days of billing information combined with real-time usage. For Kubernetes environments, this process can be accelerated, with baselines forming in just 24–48 hours. During this learning phase, it’s best to avoid major architectural changes so the system can accurately capture normal spending patterns. Once the baseline is set, it continuously updates to reflect stable costs while accounting for factors like weekday versus weekend usage, monthly billing cycles, and planned deployments. This reduces the risk of false positives.
To further refine accuracy, many systems use minimum impact thresholds to filter out minor fluctuations. For instance, some platforms might analyze 30 days of spending history and only trigger alerts when deviations exceed a specific dollar amount. This approach prevents unnecessary notifications caused by small, routine changes in spending.
Identifying Different Types of Anomalies
With a baseline in place, the system can identify various types of anomalies. By applying time-series modeling to historical billing data, it forecasts expected spending patterns. Any actual spend that falls outside a typical 90% to 95% prediction range is flagged as an anomaly. These alerts can occur at different levels – SKU, service, or project – helping to catch issues ranging from narrow misconfigurations to larger architectural problems. For example, tracking metrics like cost per API call or cost per virtual machine hour can highlight inefficiencies even when total spend appears normal.
Anomalies come in different forms, such as sharp spikes, gradual increases, or unexpected drops. Each type requires a unique response, making it essential not just to detect the anomaly but also to understand its context. This ensures the appropriate action is taken to address the issue effectively.
Accounting for Seasonality and Growth
Static thresholds often struggle to differentiate between legitimate growth and wasteful spending. For example, a surge in API calls from a successful marketing campaign is very different from a runaway script generating unnecessary requests. Advanced detection systems address this by incorporating seasonal patterns into their models. These patterns might include weekday versus weekend usage, monthly billing cycles, quarterly peaks, or holiday-related trends. Instead of relying on fixed limits, these systems use dynamic thresholds that adapt as workloads scale. Rolling averages and standard deviation calculations help separate routine variations from genuine anomalies.
To further reduce false positives, many tools suppress alerts during predictable high-spend events, like planned product launches. Feedback loops also play a role, refining the detection process over time. However, some cloud-native tools may experience a slight detection delay – typically 1–2 days – since they rely on complete daily cost data for accurate comparisons.
Configuring Alert Thresholds and Rules
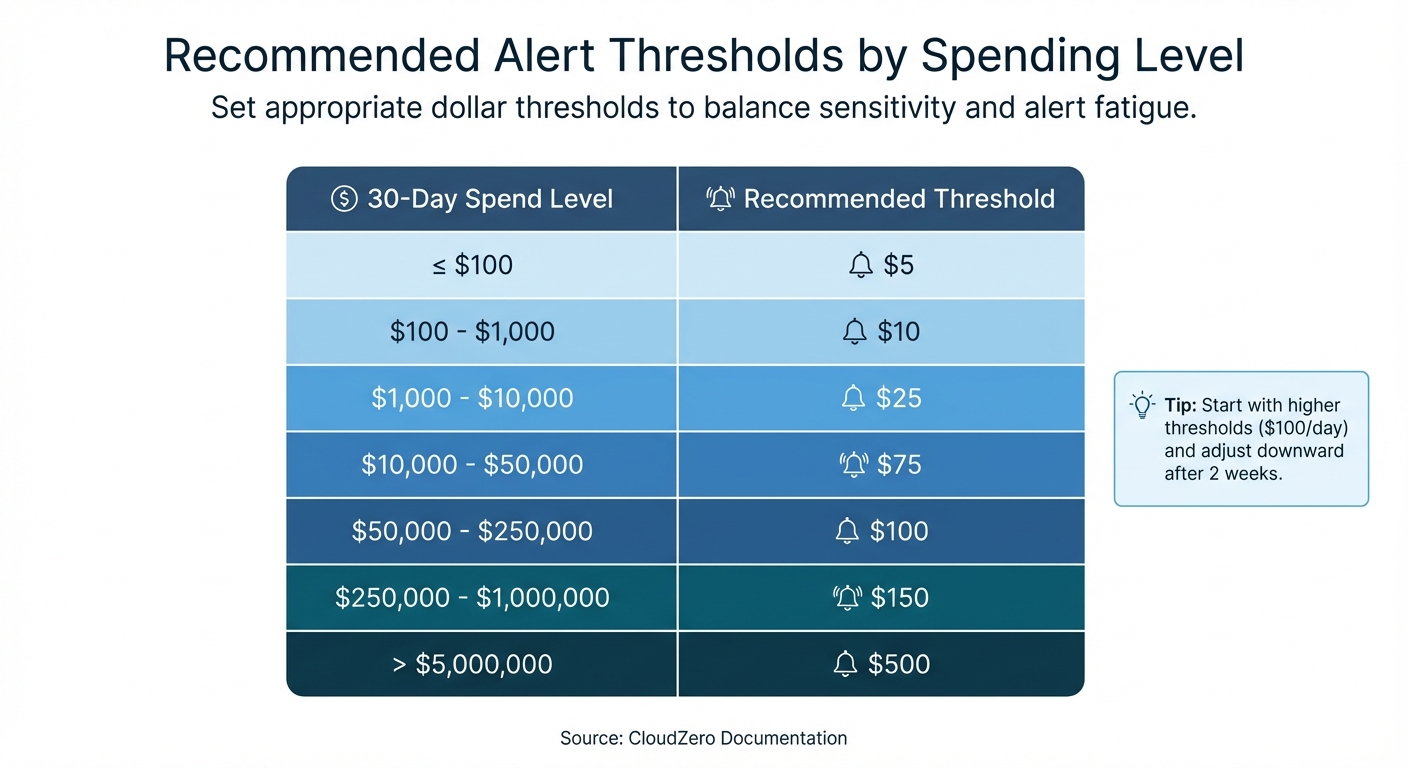
Recommended Alert Thresholds by Monthly Cloud Spending Level
Once you’ve established dynamic baselines, the next step is setting precise alert thresholds to ensure timely and actionable responses. These thresholds help pinpoint real issues while avoiding unnecessary noise.
As Ben Johnson, CTO of Obsidian Security, explains:
"You don’t want your team hesitating to solve risky technical problems because a choice might add $100 to the bill. At the same time, no CTO or CFO wants to discover a whole couple of weeks later that something has spun out of control and burned thousands in unnecessary spend".
To strike this balance, combine fixed-dollar thresholds with percentage-based thresholds. Mature FinOps teams often use dual-layered logic, where an anomaly must breach both a percentage deviation (e.g., 20% above baseline) and an absolute dollar amount (e.g., $25 or more). This approach filters out minor fluctuations in low-cost services while flagging significant financial impacts.
Fixed Dollar vs. Percentage-Based Thresholds
Fixed dollar thresholds trigger alerts when spending exceeds a specific dollar amount, such as $1,000 over the expected budget. These are particularly useful for monitoring high-spend services, project budgets, or leadership-level oversight, where any spike could pose a financial risk.
Percentage-based thresholds, on the other hand, trigger alerts when spending deviates by a defined percentage, like 20% above the baseline. This method adapts well to growth. For instance, a 50% increase on a $10/day microservice might be insignificant, but the same percentage spike in a $10,000/day service would demand immediate attention.
Many platforms now offer automated sliding scales that adjust thresholds based on spending patterns, reducing the need for manual recalibration as your infrastructure evolves.
| 30-Day Spend Level | Recommended Threshold |
|---|---|
| <= $100 | $5 |
| $100 – $1,000 | $10 |
| $1,000 – $10,000 | $25 |
| $10,000 – $50,000 | $75 |
| $50,000 – $250,000 | $100 |
| $250,000 – $1,000,000 | $150 |
| > $5,000,000 | $500 |
Source: CloudZero Documentation
Start with higher thresholds, such as $100/day, to avoid overwhelming your team with alerts. After two weeks, review the anomalies flagged and adjust the thresholds downward as the system becomes more aligned with your environment.
These methods lay the groundwork for creating targeted alerts tailored to specific teams and projects.
Setting Alerts by Team, Service, and Project
Customizing alerts by organizational levels ensures that the right teams are notified about relevant anomalies. Using your established baselines, you can set up alerts that are specific to services, teams, or projects. For example:
- Service-level monitors can track costs across all AWS services.
- Account-level monitors can focus on specific linked accounts or business units.
For high-cost drivers like EC2, RDS, or GPU instances, tighter thresholds are recommended. In Kubernetes environments, you can define namespace-specific budgets. For instance, a production namespace might have a $500 alert threshold, while a development namespace might trigger alerts at $50. This level of granularity ensures that smaller workloads aren’t overshadowed by higher-cost namespaces.
Adding metadata from your configuration management database (CMDB) – such as the application name, environment, or owner – can enrich alerts. This ensures notifications reach the correct Slack channel or email inbox instead of being lost in a general queue. For critical services, this setup allows the relevant team to respond immediately.
Tuning Sensitivity to Reduce Alert Fatigue
Top-performing FinOps teams aim for a false-positive rate below 10%. To achieve this, implement tiered alerting with varying severity levels:
- Low-impact anomalies ("Info"): Route to Slack channels for general awareness.
- Medium-severity issues ("Warning"): Send via email for team review.
- Critical spikes: Use PagerDuty or similar tools for immediate escalation.
Suppression windows can help mute alerts during predictable high-spend events, such as product launches, scheduled load tests, or month-end billing cycles. This prevents unnecessary noise while maintaining vigilance during regular operations.
Set a minimum cost impact floor – typically between $50 and $100 – to filter out anomalies that meet percentage thresholds but aren’t operationally significant. For instance, a 200% spike on a $5 service might not justify engineering time.
Finally, enable feedback loops to improve detection accuracy over time. Machine learning models can use this feedback to refine what qualifies as a genuine anomaly.
Fine-tuned alert thresholds and sensitivity settings not only reduce noise but also streamline root cause analysis and pave the way for automated responses.
Finding Root Causes of Cost Anomalies
Once you’ve set up precise alerts, the next step is crucial: figuring out what’s causing the issue. Cost anomalies often account for a big chunk of your monthly bill, so the quicker you identify the root cause, the faster you can stop unnecessary spending.
Detection tools, like AWS Cost Explorer, help by ranking contributors and linking directly to detailed cost analyses. Take this example from AWS in 2024: a FinOps analyst noticed a $5,000 spike in CloudWatch costs. Using advanced root cause analysis, the team pinpointed three main culprits: the "Morpheus_Recommendations" team (due to a planned feature release increasing log processing), the "Atlas_Analytics" team (new regulatory log storage), and the "Phoenix_CustomerPortal" team (unexpected third-party log ingestion growth). Thanks to this approach, the issue was resolved in just an hour.
Analyzing Cost Data by Resource and Service
Start by breaking down costs across dimensions like cloud service, linked accounts, regions, usage types, and cost allocation tags. Focus first on the biggest cost drivers. For containerized environments, historical allocation data helps trace costs by workload, namespace (often tied to teams), and cluster.
Third-party tools can map raw billing data to a Configuration Management Database (CMDB), linking resources to specific applications, environments, and owners’ emails. This process transforms generic alerts into actionable insights. For instance, anomalies can be traced to specific SKUs or resource metrics, such as NAT gateway egress, GPU node pool activations, or storage I/O spikes.
Separating Growth from Misconfigurations
To tell the difference between healthy growth and errors, analyze derived metrics like cost per transaction, cost per VM hour, or cost per customer. This helps turn raw data into actionable insights. Legitimate growth usually shows a clear link between increased usage or revenue and higher spending, while misconfigurations often appear as spikes in unit costs, even when overall usage stays steady.
Trevor Marshall, CTO & Co-Founder at Current, highlights this approach:
"We get alerted on any anomalous changes, oftentimes because someone misconfigured a job, or a workload is running in an unintended way. That proactive communication keeps us from having to do the retroactive investigation".
Before assuming a spike is due to a technical error, check if it’s tied to a feature release or marketing campaign. If spending increases but unit metrics remain stable, it’s likely tied to healthy business growth. Common misconfiguration issues include autoscaler errors, runaway pods, orphaned storage volumes (like EBS), and forgotten GPU instances from experiments.
Connecting Cost Spikes to Deployments
Linking cost changes directly to recent code deployments or configuration updates is key to understanding whether a spike stems from engineering changes or organic traffic growth. This requires mapping resources to applications, environments, and owners using tags or a CMDB.
Modern tools can analyze combinations of service, account, region, and usage type to pinpoint specific drivers. For example, they can identify a particular Lambda function in a production account that’s causing a spike. In Kubernetes environments, costs should be analyzed by namespace and workload to find over-provisioned or misconfigured pods or deployments.
Set up response pipelines to automatically pull in context about recent deployments or updates when a cost alert is triggered. Tomas Kozlovskis from Cast AI emphasizes:
"Investigating a cloud cost issue doesn’t have to take hours or days. If you have access to all the reports… you can keep your engineers productive and happy".
Look for recurring patterns in anomalies. For example, if development accounts frequently show spikes, it could point to a systemic lack of cost controls rather than isolated issues. Mapping spend to deployments in this way creates a clear path for automated fixes.
Automating Responses to Cost Anomalies
Once you’ve pinpointed the cause of a cost spike, quick action is essential to stop unnecessary spending. Automated workflows step in here, reacting immediately without waiting for manual input. This shift – from simply reacting to proactively managing costs – is especially crucial for scaling SaaS and AI-driven businesses.
As Nawaz Dhandala from OneUptime puts it:
"Budget alerts tell you when spending is out of control. Budget Actions actually do something about it… It’s the difference between a smoke detector and a sprinkler system."
By combining automation with ongoing cost management, companies can cut their AWS bills by as much as 40%. The focus is on moving beyond notifications to automatic actions that resolve issues as they arise.
Setting Up Policy-Based Automated Actions
Policy-based automation is all about creating rules that trigger specific responses when spending crosses set thresholds. For instance, tools like AWS Cost Anomaly Detection or Azure Cost Management can establish dynamic baselines for monitoring. AWS typically needs at least 10 days of historical data to build an accurate model. Once detection is in place, you can create IAM roles with permissions (e.g., ec2:StopInstances or iam:AttachRolePolicy) and trust policies, allowing the monitoring service to execute necessary actions.
A tiered escalation strategy works well for managing these responses:
- At 80% of your budget, send warnings via Slack or email.
- At 100%, apply restrictive IAM policies to block new resource creation.
- At 120%, enforce account-level lockdown using Service Control Policies (SCPs).
This approach ensures minor issues are flagged early while larger problems are addressed immediately.
For production environments, it’s wise to require manual approval for automated actions until you’re confident they won’t disrupt critical services. Test these workflows in a sandbox account with a small budget (e.g., $100) to confirm that actions trigger and reverse correctly. Also, make sure "Deny" policies don’t interfere with essential read operations like Describe.
These automated policies should feed directly into your incident management system, ensuring that alerts lead to swift and coordinated responses.
Connecting to Incident Management Systems
To ensure the right people are alerted quickly, automated workflows should integrate with tools like PagerDuty, Slack, or Microsoft Teams.
Accountability is easier to establish when resources are tagged properly. For untagged resources, you can use Cost & Usage Reports (CUR) alongside CloudTrail logs to track down the responsible IAM principal.
In Kubernetes environments, tools like Kubecost can work with Prometheus and Alertmanager to route cost anomaly notifications to the relevant team channels based on namespaces. On Google Cloud, budget alerts can be routed through Pub/Sub to Cloud Functions, which might automatically scale down GKE node pools or stop Compute Engine instances tagged with environment: dev.
One thing to watch out for: native cloud tools can take up to 24 hours to detect anomalies after a resource is launched, while third-party tools often catch issues within 5–15 minutes. This delay highlights the importance of integrating real-time notifications with incident management systems.
Once notifications are streamlined, the next step is to automate detailed remediation tasks.
Creating and Assigning Remediation Tasks
Remediation tasks should be specific and actionable. Each task should include details like the anomalous amount, the expected spending range, the affected scope (e.g., subscription, resource group, or account), and a direct link to the cost analysis view for further investigation.
Serverless functions or orchestration tools can trigger these tasks automatically. Common actions include shutting down idle resources, scaling back services, or applying restrictive policies. For example, EventBridge and Lambda can detect "Over-provisioned" findings and send formatted notifications to resource owners with estimated savings.
To avoid unintended disruptions, use resource tags (e.g., critical: true or no-auto-shutdown: true) and rate-limiting to ensure critical workloads are only affected once per day. Additionally, configure actions to reverse automatically when a new billing cycle begins or when spending drops back below the threshold. Document reversal processes clearly so teams know how to restore normal operations if needed.
In high-stakes scenarios, consider requiring manual approval for remediation tasks until the detection model has been fully validated.
Standardizing these processes with Infrastructure-as-Code (IaC) tools like Terraform ensures consistency across accounts. For example, you can deploy anomaly monitors and subscriptions to every new project from the start, creating a "digital tripwire" for cost control. These strategies elevate your cost management approach from reactive problem-solving to proactive governance.
Detecting Anomalies Across Multiple Cloud Providers
Managing costs across multiple cloud providers like AWS, Azure, and GCP can feel like solving a giant puzzle. Each provider uses its own billing structure – AWS organizes by accounts, Azure by subscriptions, and GCP by projects. As spending grows from $10K to $500K, relying on spreadsheets for tracking becomes impossible. One technology integrator learned this the hard way in December 2025, when constant Excel crashes and mismatched reports forced them to rethink their entire approach.
But the challenge isn’t just gathering data – it’s making sense of it. AWS updates costs daily, Azure refreshes nightly, and GCP provides near-real-time data. As Adam Cobb and Joe Karlsson from CloudQuery explain:
"The problem is that cost and asset data lives in silos. Multi-cloud organizations need a single source of truth for financial and operational visibility that they can tap into whenever it’s required."
Without unified monitoring, organizations can waste 30–40% of their cloud resources. However, with proper visibility, that waste can drop to under 10%. The key is creating a centralized system that treats all cloud spending consistently, no matter the provider.
Combining Spending Data from Multiple Clouds
The first step in managing multi-cloud costs is consolidating billing data into one place. This can be done by automating daily scripts to pull AWS Cost and Usage Reports (CUR), Azure EA exports, and GCP billing tables into a centralized data warehouse like BigQuery or Snowflake. Tools like CloudQuery can help ingest this data and create a unified SQL analysis layer.
Data normalization is a crucial part of this process. Using the FinOps Open Cost & Usage Specification (FOCUS), you can standardize different billing schemas. For example, you might align AWS’s "Cost Center" with Azure’s "Department" under a consistent tagging system. One technology integrator saw their billing accuracy jump from 84% to 99.8%, reduced mismatches by over 15%, and saved 25 hours per week on manual reconciliation by adopting FOCUS principles.
When centralizing data, it’s better to use "append" mode instead of "overwrite." This keeps historical records of deleted resources, which are essential for long-term trend analysis and anomaly detection. To handle unexpected changes, like renamed fields or updated pricing attributes, version your schemas. Automating quality control is another smart move – set up alerts to flag any variance over 1% between normalized data and raw exports.
Once your data is standardized, you can apply uniform methods to detect anomalies across all platforms.
Applying Consistent Detection Rules
To catch anomalies effectively, establish consistent statistical rules across providers. For instance, set alerts for spending that exceeds 150% of a 7-day rolling average.
| Feature | AWS Cost Anomaly Detection | Azure Cost Management | Google Cloud (GCP) |
|---|---|---|---|
| Default Status | Active by default (newer accounts) | Must be manually enabled | Enabled by default |
| Detection Method | ML-based (services, accounts, tags) | WaveNet ML algorithm | AI model (historical/seasonal trends) |
| Threshold Customization | High (absolute or % impact) | Low (no user-defined thresholds) | Moderate (spending thresholds allowed) |
| API Access | Available for workflow integration | Not supported for anomaly alerts | Supported via Pub/Sub or email |
Using percentage-based thresholds instead of fixed dollar amounts can help reduce unnecessary alerts. For example, you might only trigger notifications if spending increases by 20% and the impact is at least $100. Tools like Terraform can deploy consistent anomaly detection rules across providers, while Prometheus recording rules can precompute hourly and daily cost data for quicker cross-platform evaluations.
Once your detection rules are in place, route all alerts into a unified incident management system to simplify responses.
Setting Up Cross-Platform Alerts
Instead of just tracking total spend, focus on unit costs – like cost per VM hour or cost per transaction. Sudden changes in these metrics can signal configuration issues or pricing inefficiencies. Monitoring these derived metrics across all providers helps catch subtle problems early.
For Kubernetes environments, tools like Kubecost can integrate with Prometheus and Alertmanager to send cost anomaly alerts to specific team channels based on namespaces.
Keep in mind that AWS doesn’t support anomaly detection for certain services, such as Marketplace, Support, or Route 53. This can leave gaps in visibility when managing multi-cloud environments.
As one Director of Cloud Financial Strategy put it:
"Achieving a single-pane view of AWS, Azure, and GCP costs was once just a vision. Today, it’s our operational reality. With unified data and transparent accountability, we’ve eliminated the guesswork from cloud spend."
Conclusion
The transition from basic budget alerts to automated anomaly detection marks a major evolution in how SaaS and AI companies handle cloud costs. Traditional alerts only notify teams after spending thresholds are exceeded. In contrast, real-time anomaly detection identifies unusual patterns within minutes, allowing teams to take action before the billing cycle ends.
A robust approach involves setting detailed baselines, using statistical methods like Z-scores combined with machine learning to account for seasonal trends, and automating responses rather than just sending alerts. By connecting detection systems with tools like PagerDuty or Slack and using automation platforms such as AWS EventBridge or Lambda, companies can initiate immediate fixes.
Consider these examples: Upstart saved $20 million, Drift saved $2.4 million, and PicPay saved $18.6 million by implementing comprehensive "Detect-Investigate-Remediate" workflows. These workflows turn cost anomalies into actionable tasks for engineering teams, demonstrating the potential for addressing even more unpredictable spending in AI-heavy environments.
For AI companies, the risks are even greater. AI-related expenses can spiral out of control quickly due to even minor errors. Monitoring unit costs – like the cost per AI request – rather than just overall spending helps catch these issues early. Ben Johnson, Co-founder and CTO of Obsidian Security, sums it up well:
"Every engineering decision is a cost decision."
To make cost monitoring a core engineering priority, companies should deploy cost monitors with Infrastructure-as-Code, enforce tagging policies to track every dollar, and retrain machine learning models to reflect legitimate growth. With infrastructure costs rising by 6% to 12% and roughly 27% of cloud spending going to waste, automated anomaly detection is critical for maintaining profitability at scale.
FAQs
How do I tell healthy growth from a cost anomaly?
Healthy cloud spending typically grows steadily, reflecting planned scaling, new feature rollouts, or increased usage. But a cost anomaly – a sudden, unplanned spike or deviation – signals something unusual. To catch these early, rely on real-time monitoring tools that compare current spending to historical trends, while accounting for factors like seasonality and deployment cycles. Dive deeper by breaking down costs by service, region, or resource. This helps pinpoint unexpected issues quickly, so you can address them before they escalate.
What alert thresholds should I start with for my spend?
Begin by setting alert thresholds within a 15% to 30% deviation from your usual spending habits. This range acts as an early warning system, helping you catch unusual activity and prevent overspending. As you gain more insight into your spending trends, fine-tune these thresholds to improve accuracy and effectiveness.
Which cost anomalies should we auto-fix vs. approve?
Deciding whether to automatically fix or manually approve cost anomalies depends largely on the type of issue you’re dealing with. Routine problems, like idle resources or misconfigured settings, are usually safe to handle automatically, helping to curb unnecessary expenses. On the other hand, unexpected or high-risk anomalies – think security breaches or unauthorized usage – require manual review to ensure no critical mistakes are made. The most effective strategy? Combine both methods: automate straightforward fixes while reserving manual reviews for more complex or sensitive situations.