Cost Spike War Room: Roles, Scripts, and Timers

Cloud cost spikes can wreck your budget if not addressed quickly. A cost spike war room is a structured response system to tackle unexpected surges in cloud expenses. The key? Act fast – within the first 30 minutes – to identify the root cause and take immediate action.
Here’s how it works:
- Detection: Use automated alerts to spot anomalies early.
- Response Framework: Follow a five-phase process – detection, triage, intervention, analysis, and permanent fixes.
- Team Roles: Assign specific tasks to a Cost Analyst, DevOps Engineer, Finance Lead, Product Owner, and Executive Sponsor.
- Diagnostic Tools: Use AWS, GCP, and Kubernetes scripts to pinpoint cost drivers.
- Remediation: Adjust auto-scaling, switch to Spot Instances, and right-size resources to cut costs.
Preparation is everything. With clear roles, scripts, and escalation protocols, teams can respond to cost spikes efficiently and prevent future overspending.
Team Roles in the Cost Spike War Room
A cost spike war room isn’t a one-person show – it’s a team effort that relies on five key roles working together seamlessly. Each role brings its own expertise to the table, turning potential chaos into a well-coordinated response. Think of it as a command center designed specifically for managing cloud budgets.
Here’s how each role plays a part in tackling cost spikes efficiently:
Cost Analyst (FinOps Lead): The first responder in the room, the Cost Analyst takes charge of the initial 30-minute response. Their job? Pinpoint the top cost drivers and establish baseline spending across services, accounts, regions, and tags. This triage phase sets the stage for the entire team.
DevOps Engineer: Diving into the technical details, the DevOps Engineer investigates recent deployments, CI/CD changes, and scaling events. Using tools like CloudTrail, they trace anomalies back to specific resource ARNs. Whether it’s an orphaned load balancer in an inactive region or idle virtual machines left running, they focus on identifying whether the issue stems from automated processes or manual errors.
Finance Lead: The Finance Lead steps in to quantify the financial impact. They determine whether the cost spike is a one-time event – such as a planned data migration – or a sign of a new, ongoing expense. After the dust settles, they track "Avoided Cost" as a key metric to measure ROI and decide if the spike can be absorbed or if drastic measures are needed.
Product Owner: Keeping the bigger picture in mind, the Product Owner ensures that any usage surges (like viral launches or large-scale data exports) are intentional. They align remediation efforts with business priorities, balancing the need for swift action with maintaining revenue-generating features. Their go-to metric? "Cost-per-deployment", which helps evaluate the efficiency of operations.
Executive Sponsor: Usually a CIO or CFO, the Executive Sponsor has the authority to make high-stakes decisions, like activating "kill switches" to stop production instances or applying deny IAM policies during critical moments. They also champion FinOps integration, aiming to recover the 20–40% of cloud spend often wasted on unchecked decisions. Their role bridges financial oversight with technical execution and ensures business continuity.
Together, these roles create a structured, efficient approach to managing cloud cost spikes, enabling quick and effective action when it matters most.
sbb-itb-f9e5962
Diagnostic Scripts for Cost Spike Identification
When a sudden cost spike occurs, acting quickly is essential. With the right diagnostic scripts, you can pinpoint the root cause in just minutes. These tools enable your team to identify anomalies across cloud platforms efficiently, following a rapid-response framework. Below, we’ll explore how to use command-line tools and APIs to trace cost anomalies in AWS, GCP, and Kubernetes environments.
AWS Cost Explorer CLI for Anomaly Detection
AWS provides the aws ce get-cost-and-usage command to help identify cost drivers. By running it with DAILY granularity and grouping results by SERVICE or LINKED_ACCOUNT, you can isolate the source of a spike. For example, to identify the top cost-driving services over the past seven days, you can use this command:
aws ce get-cost-and-usage --time-period Start=$(date -d '7 days ago' +%Y-%m-%d),End=$(date +%Y-%m-%d) --granularity DAILY --metrics "UnblendedCost" --group-by Type=DIMENSION,Key=SERVICE To make it easier to analyze, pipe the output into jq to rank the top 10 cost drivers.
Idle resources, like unattached EBS volumes, can silently drain your budget. To locate these unused volumes, use:
aws ec2 describe-volumes --filters Name=status,Values=available A real-world example: In November 2024, Pragmatic AI Labs faced a staggering 29,000% spike in SageMaker costs. The culprit? Active GPU instances (ml.g4dn.12xlarge) and unclosed SageMaker Canvas sessions. They resolved the issue by terminating these resources using the aws sagemaker delete-app and aws sagemaker stop-training-job commands.
Similarly, GCP provides fine-grained anomaly detection at the SKU level, making it easier to address irregular usage patterns before they lead to runaway costs.
GCP Billing API for Usage Pattern Analysis
Google Cloud’s anomaly detection works at the SKU level, offering more detailed insights than broader service groupings. This hourly tracking can detect unusual usage patterns – like sudden scaling or misconfigurations – before they snowball into major expenses. To automate responses, set up Pub/Sub notifications that either trigger remediation scripts or send alerts to Slack. Adding a minimum dollar threshold (e.g., $100) can also help filter out false positives.
Kubernetes Resource Checks with kubectl top
After analyzing AWS and GCP, Kubernetes diagnostics can provide real-time insights into resource usage. Idle pods and overprovisioned nodes in Kubernetes environments often result in unnecessary costs. Use kubectl top pods to check CPU and memory usage for each pod, and kubectl top nodes to identify underutilized or overprovisioned nodes. These commands help determine whether your cluster autoscalers are functioning correctly or if you’re paying for unused capacity. Adding tags like CostCenter or Owner to each pod and cluster can further streamline expense tracking.
"Near-real-time detection turns unplanned spend into same-day owner action, which reduces the overrun tail and stabilizes monthly reviews." – Cloudaware
Remediation Scripts for Cost Reduction
Spot a cost spike? Execute remediation scripts to trim your cloud expenses in minutes. Below are three practical workflows that DevOps teams rely on to tackle runaway costs immediately.
Adjusting Auto-Scaling Rules
Auto-scaling misconfigurations often lead to unexpected cost surges. Start by reducing the max_size parameter and implementing layered scaling policies. Here’s how:
- Target Tracking: Keep a steady metric, like maintaining CPU utilization around 60%, to handle normal traffic variations.
- Step Scaling: Address sudden spikes by adding resources based on thresholds (e.g., add one instance at 65% CPU usage, three at 80%).
- Scheduled Scaling: Reduce capacity during predictable off-peak times, like early mornings or weekends, to avoid paying for idle resources.
"Cloud scaling is easy to explain – but good scaling is invisible when it works, and painful when it doesn’t." – Ismail Kovvuru, DevOps Engineer
For web applications, consider using ALBRequestCountPerTarget instead of CPU utilization to scale based on actual traffic. To avoid premature scaling during startup spikes, set estimated_instance_warmup to match your app’s boot time. During critical periods, use disable_scale_in=true to prevent instances from being removed too soon.
These adjustments create a foundation for managing resources efficiently and keeping costs in check.
Switching to Spot Instances
Once scaling is optimized, explore cost-saving instance pricing models. Spot instances can slash costs by up to 90% compared to On-Demand pricing. However, AWS can reclaim these instances with just two minutes’ notice. To maintain stability:
- Spread workloads across multiple instance types and Availability Zones with a mixed instances policy in your Auto Scaling Group (ASG).
- Use the "capacity-optimized" allocation strategy to select instances from the most available pools, minimizing interruptions.
- Combine 20% On-Demand instances for reliability with 80% Spot instances for savings.
"The key is designing for interruption. If your application can handle instances disappearing and being replaced, you can save a fortune." – Nawaz Dhandala, Author
Monitor the metadata endpoint at http://169.254.169.254/latest/meta-data/spot/instance-action to detect interruption notices. This lets your application gracefully handle tasks like draining connections, saving checkpoints, and deregistering from load balancers. Enable capacity-rebalance in your ASG to proactively launch replacement instances when AWS issues a rebalance recommendation, often ahead of the two-minute warning.
Right-Sizing Resources with Terraform
Beyond scaling and Spot instances, right-sizing resources ensures you’re not overpaying for unused capacity. Automation tools like Terraform make this process seamless. Here’s how:
- Use Terraform variables and maps to define instance types for specific environments, such as
t3.smallfor development andt3.largefor production. - Migrate to ARM-based Graviton instances (e.g., switch from
t3.mediumtot4g.medium) for up to 40% cost savings. - Collect two weeks of CloudWatch metrics and apply Terraform’s
lifecycleblock withcreate_before_destroy=trueto ensure smooth transitions without downtime.
For Kubernetes setups, configure aws_eks_node_group with tailored instance types and use Karpenter NodePool resources with consolidationPolicy = "WhenUnderutilized" to pack pods onto the most cost-efficient nodes. Additionally, enforce CPU and memory limits at the namespace level with resource quota and limit range settings to prevent over-provisioning.
These workflows help you align your resources with actual needs, cutting costs without compromising performance.
Timers and Escalation Protocols
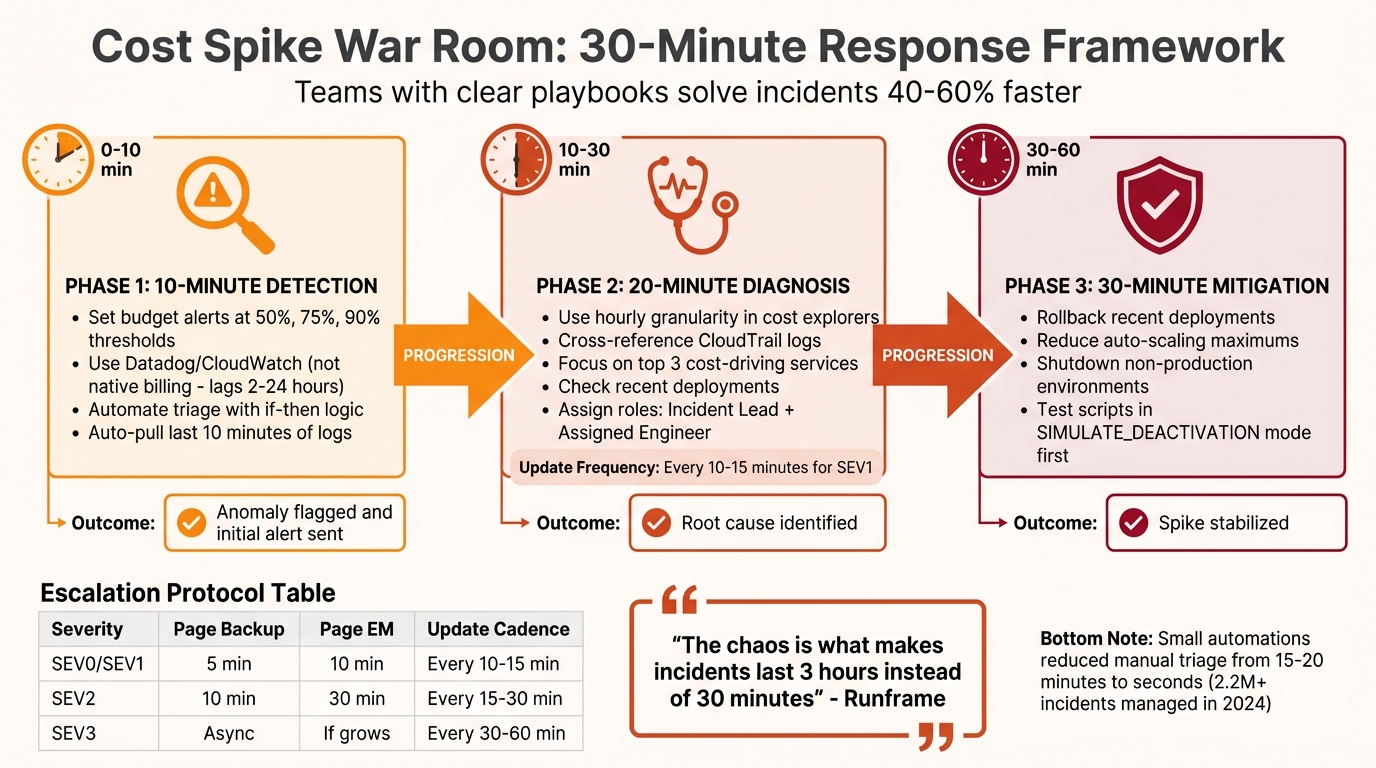
Cost Spike War Room Response Timeline: 30-Minute Framework
When it comes to managing cost spikes, speed is everything. A quick response can mean the difference between a minor hiccup and a major financial headache. This timer framework breaks down the process into clear, timed steps, ensuring teams stay focused and efficient. Without these structured time limits, hours can be wasted on coordination, letting costs spiral out of control. Often, the real culprit isn’t technical complexity but coordination delays – what should be a 30-minute fix can easily drag into hours.
Teams armed with clear playbooks solve incidents 40% to 60% faster than those relying on ad-hoc approaches. The following framework outlines three key phases, each with specific time limits and actionable steps.
10-Minute Detection: Monitoring and Alerts
Relying on native billing data for real-time alerts isn’t practical – it can lag anywhere from 2 to 24 hours. Instead, use monitoring tools like Datadog or CloudWatch integrated with your incident management platform to catch anomalies within minutes. Set budget alerts at 50%, 75%, and 90% of your planned spend, and link these alerts to systems like Pub/Sub (for GCP) or EventBridge (for AWS) to send out notifications.
Automate triage with "if-then" logic. For instance, if an alert mentions critical keywords like "payment system down" or crosses a critical threshold, escalate it to SEV1 immediately. Playbooks should also be configured to automatically pull the last 10 minutes of logs, providing instant diagnostic data. This kind of automation has slashed manual triage time from 15–20 minutes to just seconds for DevOps teams managing over 2.2 million incidents in 2024.
"Small automations add up. One script, one link, one trigger at a time – and suddenly your responders are spending less time firefighting and more time solving real problems." – Kaushik Thirthappa, Founder, Spike
Once anomalies are flagged, the next step is to zero in on the root cause.
20-Minute Diagnosis: Structured Troubleshooting
After detecting a spike, aim to identify its root cause within 20 minutes. Use hourly granularity in cost explorers to pinpoint when the spike began and cross-reference this with CloudTrail logs to find the responsible user or process. Focus on the top three services driving the costs and check recent deployments – keep in mind that leaked API keys on GitHub can be exploited in as little as 4 minutes to launch unauthorized resources.
Assign roles to streamline the process: an Incident Lead to coordinate efforts and an Assigned Engineer to handle debugging. If the issue spans multiple services or teams, bring in an Ops Lead to manage cross-team permissions. For SEV1 incidents, provide updates every 10–15 minutes, even if the estimated resolution time remains unclear.
These findings will guide the immediate mitigation steps in the next phase.
30-Minute Mitigation: Immediate Action Steps
The priority in this phase is stabilization – investigation can come later. Within 30 minutes of detection, take decisive steps like rolling back recent deployments, reducing auto-scaling maximums, or shutting down non-production environments. When in doubt, opt for a rollback rather than wasting time debating alternatives.
For automated safeguards, use tools like EventBridge or Pub/Sub to cap Auto-Scaling Groups or disable compromised API keys once thresholds are breached. Always test these scripts in a "SIMULATE_DEACTIVATION" mode first to avoid accidental production shutdowns. If the primary responder doesn’t act within 5–10 minutes, escalate by paging the backup engineer. At 10 minutes, notify the Engineering Manager, and at 30 minutes, escalate to the CTO if the issue remains unresolved.
| Severity Level | Time to Page Backup | Time to Page EM | Update Cadence |
|---|---|---|---|
| SEV0 / SEV1 | 5 Minutes | 10 Minutes | Every 10–15 Minutes |
| SEV2 | 10 Minutes | 30 Minutes | Every 15–30 Minutes |
| SEV3 | Handle Async | Only if impact grows | Every 30–60 Minutes |
"The outage is the easy part. The chaos is what makes incidents last 3 hours instead of 30 minutes." – Runframe
TechVZero for Long-Term Cost Control
Addressing immediate cost spikes is just the beginning. To truly manage expenses, your infrastructure needs to be optimized for long-term savings. While war rooms can handle short-term crises, they don’t tackle the root issue: a cloud infrastructure that’s inherently costly. Managed Kubernetes often brings hidden expenses – like virtualization, provider fees, and overprovisioning – that can double your costs over time. Essentially, the convenience you’re paying for can become a financial burden as your workloads grow.
Bare Metal Kubernetes: Lower Costs Without Sacrificing Reliability
TechVZero’s bare metal Kubernetes eliminates unnecessary provider costs. By leveraging direct hardware access and fine-tuned resource utilization, you can cut costs by 40% to 60% – no virtualization tax, no extra overhead. And here’s the kicker: reliability doesn’t take a hit. Features like multi-zone bare metal nodes, integrated storage with replication, and Kubernetes-native autoscalers ensure high performance across the board. The result? You only pay for what you actually need, without being weighed down by redundant features.
Migration Process: Tools That Simplify the Shift
Switching to bare metal starts with analyzing your current usage (kubectl top) to establish a baseline. From there, you provision nodes using Terraform. Workload migration is handled with Velero for backups and restores, while Helm charts and Kustomize ensure configurations stay in sync. A seamless blue-green cutover, facilitated by a service mesh like Istio, allows traffic to shift without any downtime. Automated scripts then fine-tune pod requests to reflect actual usage, cutting node requirements by 20% to 40%.
Here’s an example Terraform configuration for cost-efficient nodes:
resource "techvzero_bare_metal_node" "k8s_worker" { count = 3 cpu_cores = 16 # Optimized per p95 usage memory_gb = 64 instance_family = "graviton-equivalent-arm" } This streamlined process not only simplifies migrations but also sets the stage for measurable savings.
Measured Results: Savings That Speak for Themselves
Consider this real-world example: a SaaS company running a managed Kubernetes cluster for over 1 million daily requests switched to TechVZero’s bare metal solution. Their monthly costs dropped from $43,000 to $21,500 – a 50% reduction – by using Graviton-equivalent ARM nodes and optimizing pod resource requests. Despite the savings, latency stayed under 100ms, and uptime remained at 99.99%.
In another case, an AI workload saw GPU-equivalent compute costs slashed by 40%, all while maintaining training throughput. These results prove that cost reductions don’t have to come at the expense of performance.
TechVZero also integrates with tools like Prometheus, Grafana, and ELK stacks to monitor key metrics like p95 CPU, memory, and IOPS usage. Budget alerts are scoped at the namespace level, so a 10% spike triggers a Slack notification before it escalates into a full-blown crisis. This proactive monitoring helps you shift from reacting to cost spikes to preventing them altogether.
Conclusion: Building Your Cost Spike War Room
A cost spike war room can be the difference between swiftly managing an incident and watching your budget spiral out of control. To stay ahead, assign specific roles, use diagnostic and remediation scripts, and implement workflows with timers to keep the team focused. As the saying goes, "Preparation beats panic every time".
Once roles are set, it’s time to focus on detection. Use a combination of tools like budget alerts, machine-learning-based anomaly detection, and real-time notifications. These ensure crucial alerts reach the right engineer immediately, triggering severity levels – Yellow, Orange, and Red – to reduce response times by 30%.
But here’s the catch: a war room only fixes the immediate problem. If your infrastructure depends on managed Kubernetes with hidden virtualization costs and provider fees, you’re likely to face ongoing issues. Did you know that about 27% of cloud spending is wasted, and single anomalies can inflate your monthly bill by anywhere from 18% to 200%? Long-term optimization is essential. TechVZero’s bare metal Kubernetes solution addresses this by cutting costs by 40% to 60% while maintaining the reliability you need.
To stay prepared, regularly run tabletop drills, automate non-production kill switches, and update remediation scripts. The ultimate goal? Not just surviving the next spike but creating a system where spikes are rare, manageable, and predictable. By combining a well-organized war room with an optimized infrastructure, you can turn cost spikes into a thing of the past.
FAQs
What should we do in the first 30 minutes of a cost spike?
In the first 30 minutes, your priority is to confirm the spike, pinpoint its cause, and take corrective action. Begin by enabling real-time monitoring and breaking down costs by service, region, and resource. To address the issue, consider pausing non-essential workloads, tweaking scaling policies, or shutting down idle resources. Make sure to document the incident, dig into the root cause, and implement smarter alerts to help avoid similar spikes in the future.
Which alerts catch cost spikes fast if billing data is delayed?
Real-time anomaly detection systems are a game-changer for spotting cost spikes, even when billing data lags behind. By keeping an eye on dynamic baselines and unusual usage patterns, these systems can flag irregularities in real-time activity. This ensures potential issues are caught early, allowing for quick and effective responses.
What automated “kill switches” are safe to use in production?
Safe ways to implement automated kill switches in production include:
- Disconnecting billing accounts when budgets are exceeded: This ensures spending stays under control by halting operations once a predefined financial limit is reached.
- Terminating underused resources or pausing workloads: By identifying and stopping unnecessary processes, you can prevent additional costs without significantly impacting essential operations.
These strategies are designed to handle unexpected spending spikes while keeping disruptions to a minimum.