Caching at Scale: Strategies That Cut CI Time and Cost

Your CI pipeline could be wasting time and money. Default setups often rebuild everything from scratch, leading to inefficiencies as teams grow. But caching can dramatically reduce build times and costs by reusing work already done. For example:
- A 14-minute GitHub Actions workflow can drop to 90 seconds with effective caching, cutting costs by 87%.
- Docker layer caching, dependency proxies, and distributed caching systems can save hours of CI time per week.
- Teams have reported savings of over $18,000 per month by optimizing CI pipelines.
Key strategies include:
- Docker Layer Caching: Reuse Docker layers to speed up container builds.
- Distributed Caching: Minimize redundant downloads across CI runners.
- Dependency Proxy Caching: Cache libraries locally to avoid rate limits and reduce bandwidth.
- Artifact Storage Optimization: Deduplicate and tier storage for faster access and lower costs.
Simple changes, like restructuring Dockerfiles or using caching tools, can yield massive performance gains. With AI-driven development increasing code and test volumes, caching ensures pipelines remain fast and cost-efficient.
Speed Up Your CI Pipelines with Docker Layer Caching
sbb-itb-f9e5962
Docker Layer Caching: Faster Containerized Builds
Docker builds its images in layers, with each instruction in a Dockerfile forming a separate layer. The caching process is sequential, meaning if one layer changes, Docker rebuilds that layer along with all subsequent layers. This makes the order of your Dockerfile instructions incredibly important. For instance, stable instructions like installing system packages should be placed at the top, while instructions prone to frequent changes – such as copying source code – should go toward the bottom. A good example of this strategy is copying a package.json file and running npm install before copying the rest of your application code. This ensures dependencies are only rebuilt when the manifest file changes.
How Docker Layer Caching Works
Docker’s caching mechanism is content-aware. For COPY and ADD instructions, it calculates a checksum of the files being added. If the checksum or file metadata changes, the cache for that layer is invalidated. For RUN commands, Docker checks the exact text of the command and reuses the cached result if it matches a prior build.
Modern Docker builds use BuildKit, which improves on the older builder. BuildKit allows parallel layer building and introduces advanced cache mounts. These mounts let you persist package manager data – like node_modules or ~/.cache/pip – between builds without including them in the final image. These features make Docker layer caching especially effective in CI pipelines.
Setting Up Docker Layer Caching
To optimize your Dockerfile, start by copying dependency manifests (like package.json or go.mod), then run installation commands, and finally copy your application source code. This separates dependency caching from application code changes.
Enable BuildKit by setting DOCKER_BUILDKIT=1 in your environment. For CI systems like GitHub Actions, the docker/setup-buildx-action can configure BuildKit automatically. Since CI runners are typically ephemeral, you’ll need an external cache backend to persist layers between builds. GitHub Actions offers a native cache backend (type=gha), or you can use a container registry with a flag like --cache-to type=registry,ref=image:cache,mode=max.
Additionally, create a .dockerignore file to exclude unnecessary files (e.g., .git, node_modules, or build artifacts) that could slow down context uploads. Cache mounts can also help; for example, use RUN --mount=type=cache,target=/root/.npm npm install to persist package manager downloads across builds.
Performance Gains from Docker Layer Caching
With a well-optimized Dockerfile and caching in place, you can achieve significant performance improvements. In January 2026, a monorepo with six Go microservices reduced CI build times from 8 minutes per service to just 90 seconds. By separating the go.mod and go.sum copy instructions from the rest of the source code, the module download layer was cached for 95% of builds. This adjustment cut the total pipeline time from 48 minutes to 9 minutes.
Another example comes from a project led by Nawaz Dhandala in February 2026. His team reduced build times from 11 minutes to 90 seconds, an 86% improvement, saving around 250 hours of CI runner time each month.
"Docker layer caching is the difference between a 6-minute CI build and a 45-second one." – How2.sh
A well-optimized caching setup can achieve cache hit rates of 85% to 90% on source code changes. To confirm caching is working, run builds with --progress=plain and check for the CACHED prefix in the logs. You can also calculate your cache hit rate by dividing the number of cached layers by the total layers and multiplying by 100. If your hit rate falls below 50%, it may be time to revisit your Dockerfile structure. These optimizations can drastically reduce time and costs, making them a crucial part of scaling CI pipelines efficiently.
Distributed Caching Systems: Cutting Redundant Downloads
Distributed caching takes CI pipeline efficiency to the next level by tackling the issue of redundant downloads across geographically dispersed CI runners. Imagine multiple runners in different regions repeatedly downloading the same Docker images, NPM packages, or Maven dependencies – this not only slows things down but also strains resources. That’s where distributed caching systems like Varnish Enterprise come in. Acting as a middle layer between CI/CD pipelines and artifact repositories (like Artifactory, S3, or Docker Hub), these systems intercept HTTP-based requests and serve cached content locally or from edge servers. This approach drastically reduces latency and improves CI performance overall.
For example, in March 2024, an enterprise software company handling 1,000 TB of artifact traffic each month integrated Varnish Enterprise with its Massive Storage Engine (MSE). The results? Build speeds jumped by 80%, Artifactory API calls dropped by 70%, and egress fees shrank by 20%. Similarly, a SaaS company using JFrog Artifactory saw an 85% reduction in artifact retrieval time and a 30% drop in CI/CD failures after deploying Varnish.
Why Distributed Artifact Caching Works
The success of distributed caching lies in its ability to minimize redundant downloads and slash latency. By placing cache instances in regional points of presence (POPs) near CI runners, artifacts can be pulled from local caches rather than distant repositories. This reduces retrieval times from seconds to mere milliseconds. The first request fetches the artifact from the origin, but subsequent requests are served from the cache.
Varnish amplifies this efficiency with its Massive Storage Engine (MSE), which marries the speed of RAM with the storage capacity of disk. This setup allows for the persistent storage of multi-terabyte datasets, even surviving service restarts. Using the Varnish Configuration Language (VCL), organizations can define caching policies with tailored TTLs. For instance, Docker manifests might have a TTL of 5 minutes, while blob layers could be cached for an hour – striking a balance between speed and freshness. Cache hit rates for commonly used container images often exceed 90–95%.
Security is also a priority. For private repositories, Varnish performs preflight authorization by sending lightweight requests to the origin to verify user credentials before serving cached artifacts. This ensures secure access without adding delays. Distributed teams have reported job start times improving by 2x to 10x when artifacts are served from edge caches instead of remote registries.
Setting Up Varnish for CI Pipelines
Integrating Varnish into your CI pipeline is straightforward and directly addresses the bottlenecks caused by redundant downloads. Start by installing Varnish Enterprise and configuring the default.vcl to point to your origin registry, whether it’s Artifactory, Nexus, or Docker Registry. To ensure secure access, add the artifactory.vcl file, which enforces preflight authorization by verifying user permissions through lightweight HEAD requests before serving cached artifacts.
For optimal performance, configure MSE with EXT4 volumes on SSDs and use the mkfs.mse4 command to pre-allocate files. This reduces IOPS and prevents fragmentation during high-concurrency operations. Additionally, set up VCL logic to intercept Docker Registry v2 protocol requests. Use beresp.grace to serve slightly stale content if the origin registry is slow or temporarily unavailable.
If you manage multiple artifact types, consider running Varnish Orca via Docker or Helm. Orca consolidates various registries (Docker, NPM, Go, Helm) into a single accelerated endpoint. To avoid redundant permission checks on the origin registry, include the Authorization header in the cache key for HEAD requests.
"Varnish reduced the pressure on our build systems almost immediately. Stability improved across the board." – DevOps Lead, Fortune 500
Dependency Proxy Caching: Faster Library Fetches
Distributed caching helps reduce redundant artifact downloads across regions, but dependency proxy caching takes it a step further by optimizing how external libraries are fetched. When CI pipelines rely on registries like Docker Hub, Maven Central, or npm, they consume bandwidth and risk hitting rate limits. A dependency proxy acts as a middleman between your CI/CD pipeline and these registries, downloading a dependency once and storing it locally. After that, any subsequent requests pull from the internal cache instead of the internet. This process not only speeds up builds but also trims cloud costs, making CI pipelines more efficient overall.
The advantages are immediate. For example, Docker Hub caps anonymous users at 100 pulls every 6 hours and authenticated free users at 200. If your organization runs dozens – or even hundreds – of CI jobs daily, you’ll hit these limits fast. A dependency proxy consolidates all internal requests into a single upstream pull, effectively making your entire organization look like a single user to the external registry. Plus, instead of spending minutes pulling a 500MB image from the internet, you can retrieve it in seconds from your local cache. This cuts down both egress time and associated costs.
How Dependency Proxy Caching Works
The first time a dependency is requested, the proxy fetches it from the upstream source – like Docker Hub or Maven Central – and stores it locally. Any future requests for the same dependency are served directly from the cache, avoiding another trip across the internet. Modern proxies also include mechanisms to ensure the cache is up-to-date. For instance, lightweight HEAD requests can check ETags or manifest digests to confirm the dependency’s freshness. GitLab‘s dependency proxy, for example, uses HEAD requests to Docker Hub for manifest validation, which are free and don’t count against rate limits.
This setup also adds reliability. If the external registry experiences downtime or network issues, your cached artifacts remain accessible, keeping your builds running without interruptions.
"The dependency proxy is a local proxy server that downloads and stores copies of packages… This approach reduces the number of downloads from external sources and makes package builds faster."
- GitLab Docs
These caching practices translate directly into faster operations, as seen in the setup instructions below.
Implementing Dependency Proxy Caching
To set up a dependency proxy, you need to configure your CI pipeline to point to the proxy endpoint instead of the public registry. For Maven dependencies, update files like pom.xml, build.gradle, or build.sbt to use the proxy URL as a repository source, ensuring Basic HTTP authentication is in place. For Docker images, modify the Docker daemon configuration (daemon.json) or container runtime settings to use the proxy as a registry mirror. If you’re working with Google Artifact Registry, you can create a "Remote Repository" that proxies Docker Hub, enabling faster pulls within the same cloud region.
Terraform workflows can benefit too. By setting the TF_PLUGIN_CACHE_DIR environment variable, you can cache providers across modules and pipeline runs, avoiding repeated downloads that waste bandwidth. To keep your cache manageable, implement TTL cleanup policies to delete blobs that haven’t been accessed in, say, 90 days. If you’re on a paid Docker Hub plan, configure your proxy with your credentials to take advantage of higher rate limits. For CI jobs running in parallel, use pull policies for caches to prevent multiple jobs from trying to update the same cache simultaneously, which could lead to data corruption.
"A local registry proxy cache pays for itself quickly in CI environments where dozens of jobs pull the same base images repeatedly."
- Nawaz Dhandala, Author
Artifact Storage: Reducing Cost and Improving Speed
Once dependency fetching is streamlined, artifact storage often becomes the next challenge. Surprisingly, between 50% and 80% of total build time is spent on repetitive tasks – like re-fetching existing artifacts, re-parsing unchanged build logic, or re-running identical tasks. By using checksum-based deduplication, these inefficiencies can be eliminated. This method ensures that each artifact is stored only once, using its cryptographic fingerprint. For multi-architecture Docker images, shared layers are stored a single time, dramatically cutting down on storage usage.
Another critical strategy is storage tiering. High-speed, temporary caches can be maintained on local NVMe storage, while long-term artifacts are offloaded to distributed object storage platforms such as AWS S3 or Google Cloud Storage. This hybrid model balances speed for active jobs with cost savings for archived data. To further reduce expenses, implementing a Build Artifact CDN or local edge cache can serve dependencies at LAN speeds (10–100 Gbps) and lower external data transfer costs by over 95%. With AI-assisted tools expected to increase build volumes by 500% within three years, these optimizations are essential for scaling efficiently. Together, these artifact storage methods work alongside caching techniques to eliminate redundant processes across the build pipeline.
Artifact Storage Methods
Start by compressing and deduplicating dependency directories using checksum data from lockfiles like package-lock.json or Gemfile.lock. This reduces download sizes and avoids reinstalling unchanged libraries. Content-addressable storage, using SHA256 digests, can help maintain organized, efficient storage. Automated retention policies – such as expiring intermediate build outputs after one day and general caches after 30 days – keep storage lean. Additionally, enabling tag immutability for production images ensures consistency and prevents accidental overwrites.
Private endpoints with AWS S3 caching can further reduce costs and improve performance by cutting NAT Gateway fees and lowering latency. A great example comes from VTS Engineering’s Staff SRE Dev Shah, who implemented an S3-based cache backend for GitHub Actions in April 2025. By replacing GitHub’s default 10GB-limited cache with private endpoints, the team eliminated about 12 TB of daily outbound traffic, saving $300 per day in networking costs. For parallel test jobs, adopt a pull-only cache policy to avoid race conditions and cache corruption from simultaneous uploads.
Using Bare Metal Kubernetes in CI Workflows
Artifact storage optimization shines even brighter when paired with efficient infrastructure. Bare metal Kubernetes, for instance, reduces CPU overhead by 5–15% compared to virtualized environments. For I/O-heavy CI tasks, this difference is crucial. Storage latency on bare metal NVMe is only about 0.1 ms, compared to 1–5 ms on cloud-based network block storage. Pods running on bare metal also experience 2–3x more consistent IOPS than those in virtualized setups. Additionally, internal cluster network latency is up to six times lower than on VM-based clusters, significantly speeding up artifact transfers between nodes.
The cost savings are immediate. Teams paying $800 or more monthly for managed Kubernetes nodes often recover their expenses within the first billing cycle after switching to bare metal. For example, in February 2026, a mobile development team migrated their Android CI pipeline from Bitbucket-hosted runners to self-hosted bare metal infrastructure on Hetzner (using CX53 and CX23 machines). By introducing remote Gradle Build Caches and a local Docker mirror, they slashed build times from 15 minutes to 6 minutes and reduced monthly CI costs from over $300 to roughly $87. For stateless CI pods and build caches, using a local-path provisioner on NVMe drives delivers maximum throughput with no network overhead.
Advanced Caching for Complex Pipelines
Once you’ve fine-tuned storage and infrastructure, the next step is to streamline workflows. Using techniques like conditional execution and multi-stage builds can cut out redundant steps and shrink container images. Teams that combine path filtering, parallel jobs, and multi-stage builds have reported CI/CD times dropping by 87%, with compute costs decreasing accordingly.
Conditional Jobs: Skipping Unnecessary Steps
Path filtering ensures that workflows don’t run when irrelevant files are changed. For instance, if a developer updates a README or modifies documentation, there’s no need to rebuild or test the application. Tools like GitHub Actions and GitLab CI offer paths-ignore directives, which allow you to skip jobs when changes are limited to non-functional files like markdown documents or licenses.
In monorepos, paths filters can trigger builds only for services affected by a change, saving significant time. A great example of this comes from Marcus Rodriguez, a Lead DevOps Engineer, who implemented this in a Next.js monorepo. By combining path filters, parallel execution, and Docker layer caching, his team reduced CI/CD time from 14 minutes to just 1 minute and 45 seconds. Even more impressive, their daily compute usage dropped from 560 minutes to only 70 minutes, despite making 40 pushes per day.
Breaking pipelines into parallel jobs further speeds things up. Tasks like linting and testing can run simultaneously, cutting wall-clock time and setting the stage for more efficient container builds.
Docker Multi-Stage Builds for Leaner Images
Multi-stage builds take pipeline optimization to the next level by separating the resource-heavy build environment from the lightweight production runtime. A common approach is to use a full-featured image for the build process and then copy only the necessary binaries or assets into a minimal final image, such as Alpine or Distroless. This method can reduce storage needs, transfer times, and build durations by as much as 90%.
Layer ordering is a key factor here. For example, copying dependency manifests like package.json, go.mod, or requirements.txt and installing dependencies before adding the full source code ensures that dependency layers are reused across builds. This minimizes cache invalidation and keeps builds efficient. With an optimized Dockerfile, cache hit rates on source code changes can reach 85–90%. In practice, a code-only change in such a setup might take just 15 seconds to build, compared to 110 seconds without caching – a time savings of 86.4%.
For ephemeral CI runners, pushing a :cache tag to your registry and using the --cache-from option allows new agents to reuse layers from previous builds. Additionally, enabling BuildKit lets you use cache mounts (--mount=type=cache) to persist package manager caches (e.g., /root/.npm or /go/pkg/mod) across builds without including them in the final image.
The results speak for themselves. Alpine-based images are often 5–10x smaller than Debian-based ones, and a distroless Go application image can be as small as 2 MB. These optimizations not only reduce build times but also lower compute costs, reinforcing the importance of metrics-driven CI efficiency.
"Effective caching strategies dramatically improve container build performance in CI pipelines… This translates to faster feedback loops, reduced resource consumption, and improved developer productivity."
- Nawaz Dhandala, SRE at OneUptime
Evaluating Caching Strategies with Metrics
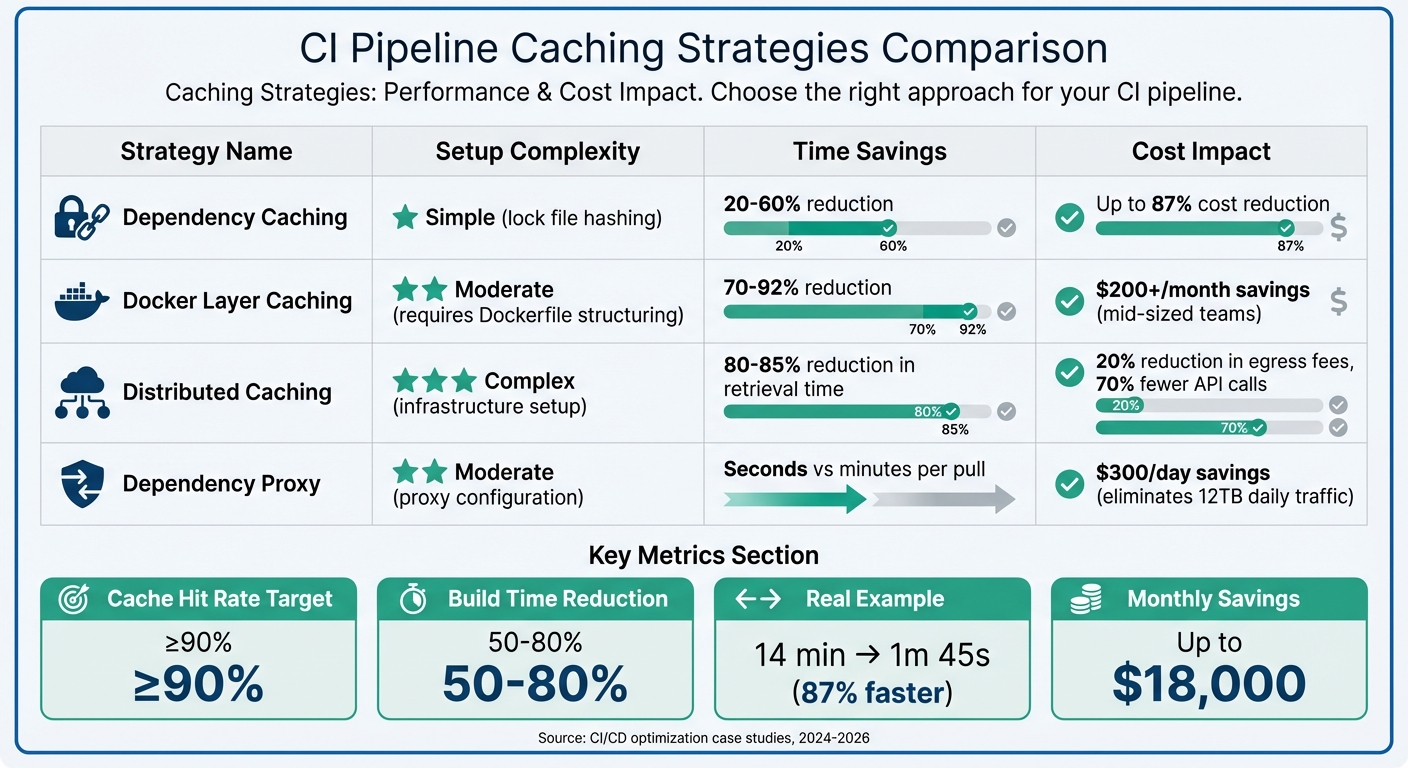
CI Pipeline Caching Strategies: Performance Impact and Cost Savings Comparison
When it comes to Docker layer, distributed, and dependency proxy caching, understanding their effectiveness boils down to tracking the right metrics. The key indicators? Cache hit rates (aim for at least 90%), build time reductions (often between 50–80%), and cost per build (calculated by dividing your monthly CI spend by the number of successful builds). These metrics provide a clear picture of how well your caching strategy is working and guide adjustments to maximize efficiency.
Caching Strategy Comparison
Different caching techniques offer varying levels of complexity and benefits. Dependency caching, which uses lock file hashing, is relatively simple to set up and can deliver time savings of 20–60% while cutting CI costs by as much as 87%. Docker layer caching, though requiring careful Dockerfile structuring, can reduce build times by 70–92% and save mid-sized teams over $200 per month. Meanwhile, path filters can bypass unnecessary runs entirely, streamlining workflows.
Here’s a real-world example: In January 2026, DevOps engineer "Dredyson" fine-tuned a Jenkins pipeline, slashing deployment costs from $8.72 to $3.14 per build – an adjustment that saved about $18,000 monthly.
"Every redundant process in your pipeline is a cost multiplier."
- Dredyson
To gauge your caching strategy’s effectiveness, keep an eye on cache hit ratios and job duration trends. However, watch out for diminishing returns – if cache transfer times exceed 30 seconds or the cache size balloons beyond 1 GB, the overhead could start eating into your gains. Tools like custom logging (e.g., du -sh node_modules/) can help pinpoint inefficiencies.
For platforms like GitHub Actions, where compute costs hover around $0.008 per minute, even minor improvements can lead to significant savings across numerous daily builds. By focusing on measurable progress, you can ensure that your CI costs remain proportional to the value your pipeline delivers.
Conclusion
This guide has explored how targeted caching strategies can transform CI pipelines. Techniques like Docker layer caching, distributed artifact systems, dependency proxies, and optimized artifact storage work together to streamline repetitive tasks. By reusing dependencies, toolchains, and build outputs, these methods save time and resources, allowing CI pipelines to operate more efficiently.
The financial and operational benefits speak for themselves. For instance, in early 2026, some teams reported cutting build times from 14 minutes to just 1 minute and 45 seconds, while others reduced Node.js build durations from 22 minutes to 2.5 minutes – leading to significant cost reductions.
"The clear path back to CI efficiency is comprehensive caching. Caching relieves pipeline pressure by reusing previous work… thereby reducing the load on CI and its dependent systems." – The Develocity Team
These strategies are particularly valuable for fast-growing AI and SaaS companies. As build volumes surge due to AI-generated code, caching becomes a necessity. Start with lockfile-based dependency caching, then incorporate Docker optimizations and distributed systems as your needs grow. Keep an eye on cache hit rates (aiming for 90% or higher) and build duration metrics to ensure your efforts yield measurable results.
Ultimately, the difference between a sluggish, costly pipeline and a fast, efficient one lies in minimizing repeated tasks. By focusing on the right caching strategies, you can process only what’s changed, cut costs, and accelerate delivery.
FAQs
Which caching strategy should I implement first in my CI pipeline?
Start with dependency caching to save time by skipping the need to reinstall dependencies during every pipeline run. This is particularly helpful for projects with a large number of dependencies, such as Node.js applications. Using tools like actions/cache, you can cache directories like node_modules or even the cache of your package manager. This approach can dramatically cut down build times, making dependency caching one of the easiest and most effective ways to optimize your CI pipeline.
How can I measure whether caching is actually saving time and money?
To gauge the impact of caching, start by tracking and comparing build metrics from before and after its implementation. Pay particular attention to three key areas:
- CI pipeline duration: Measure how long your continuous integration pipeline takes to complete. A shorter duration often indicates caching is working as intended.
- Cloud costs: Monitor expenses for compute resources. Reduced costs suggest more efficient resource usage due to caching.
- Time spent on dependency downloads and artifact reuse: Check how much time is saved in downloading dependencies or reusing previously built artifacts.
Use tools that provide performance insights or visualizations to keep tabs on reductions in build times and costs. Reviewing these metrics across multiple runs will give you a clearer picture of whether caching is improving efficiency.
What should I cache (and avoid caching) to prevent slow or flaky CI runs?
To keep your CI runs fast and reliable, it’s a good idea to cache items like dependencies – think node_modules, pip packages, or Maven dependencies – as well as Docker layers. Caching these can significantly cut down on download and build times.
However, steer clear of caching files that change often or are generated dynamically, such as build logs or temporary files. These can lead to cache invalidation headaches. Also, pay close attention to how you manage cache keys. Properly configured keys ensure that caches are only updated when needed, keeping your builds efficient and consistent.