Commitment Risk Dashboard: Signals that Predict Waste
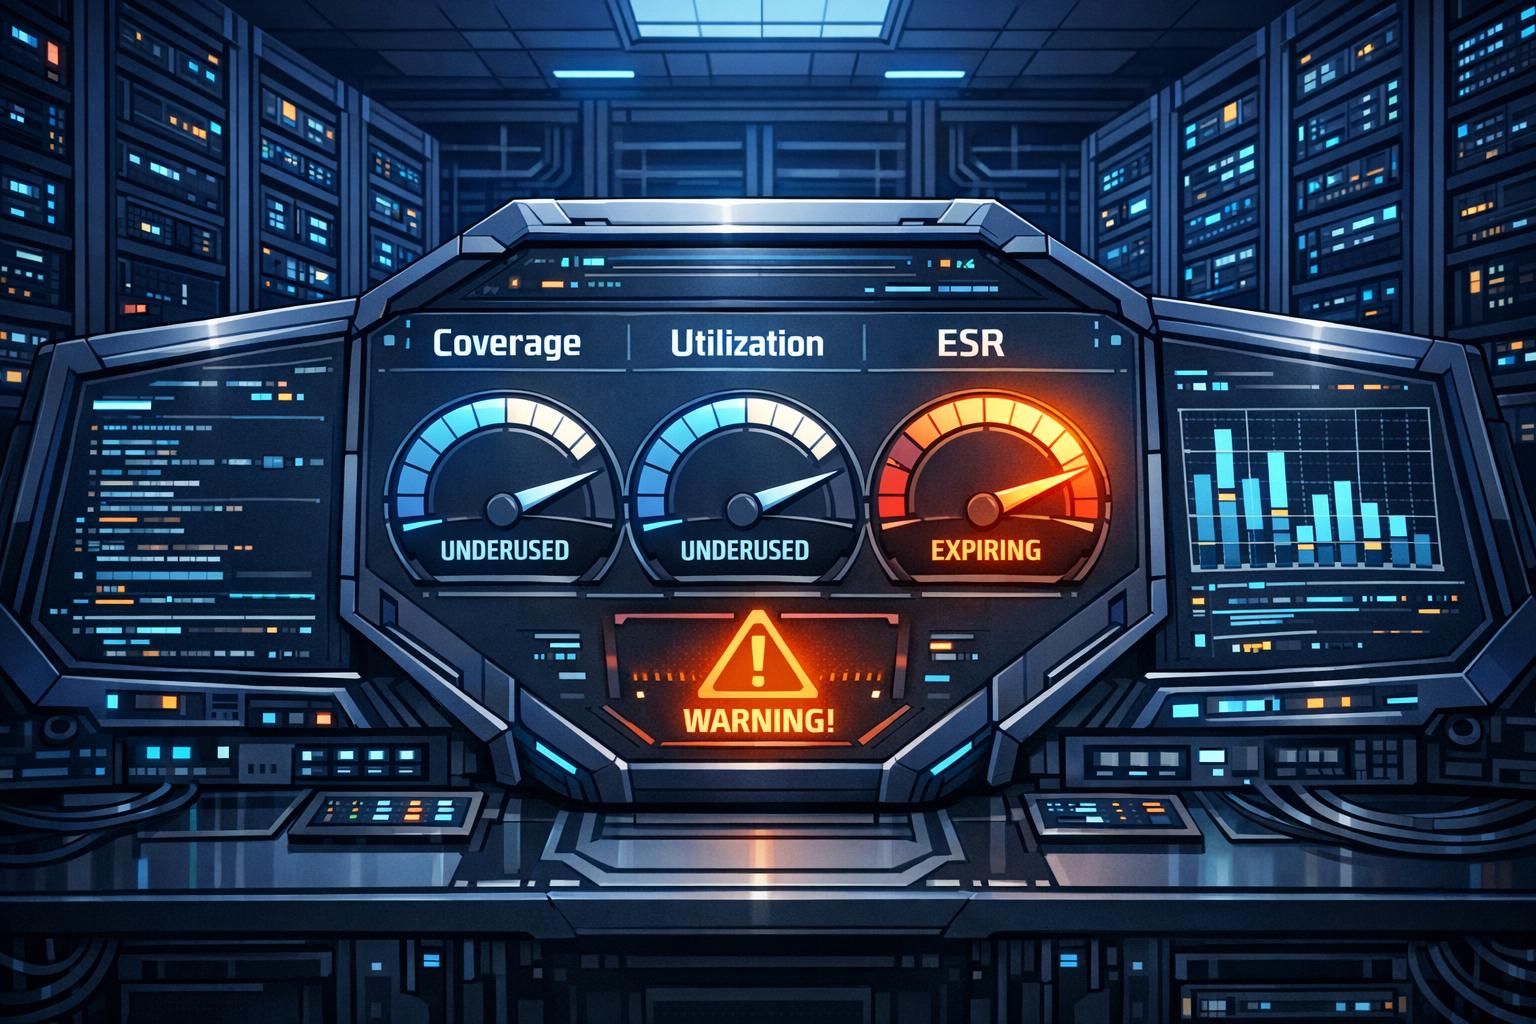
Unused cloud commitments cost money. Reserved Instances (RIs) and Savings Plans can save 30–70% on cloud costs, but only if they’re fully utilized. When left idle, these pre-paid resources become wasteful expenses. A Commitment Risk Dashboard helps identify underutilized resources, expiring commitments, and inefficiencies across regions or services.
Key metrics to track include:
- Coverage: Measures how much of your usage benefits from discounted commitments. Low coverage means you’re overpaying for on-demand rates.
- Utilization: Tracks how effectively your purchased commitments are used. Utilization below 80% signals waste.
- Effective Savings Rate (ESR): Shows how much you’re saving compared to on-demand pricing. Poor ESR reflects inefficiencies despite high coverage.
Acting on these insights is critical. For example, resizing commitments, setting alerts for expiring terms, and aligning resources with usage patterns can save thousands monthly. Tools like AWS Cost Explorer and Datadog help automate monitoring, while services like TechVZero offer tailored solutions to reduce waste further.
The bottom line: Monitoring and optimizing cloud commitments can turn wasted spend into real savings.
The Whats of Waste | The Keys to AWS Optimization | S10 E2
sbb-itb-f9e5962
Key Metrics for Predicting Commitment Waste
Cloud Commitment Metrics: Coverage, Utilization, and ESR Performance Benchmarks
To effectively manage commitment waste, you need real-time insights. Three critical metrics – Coverage, Utilization, and Effective Savings Rate (ESR) – form the backbone of any commitment risk dashboard. Each metric highlights a specific dimension of waste. Let’s break them down.
Coverage: Are You Paying Too Much for On-Demand Usage?
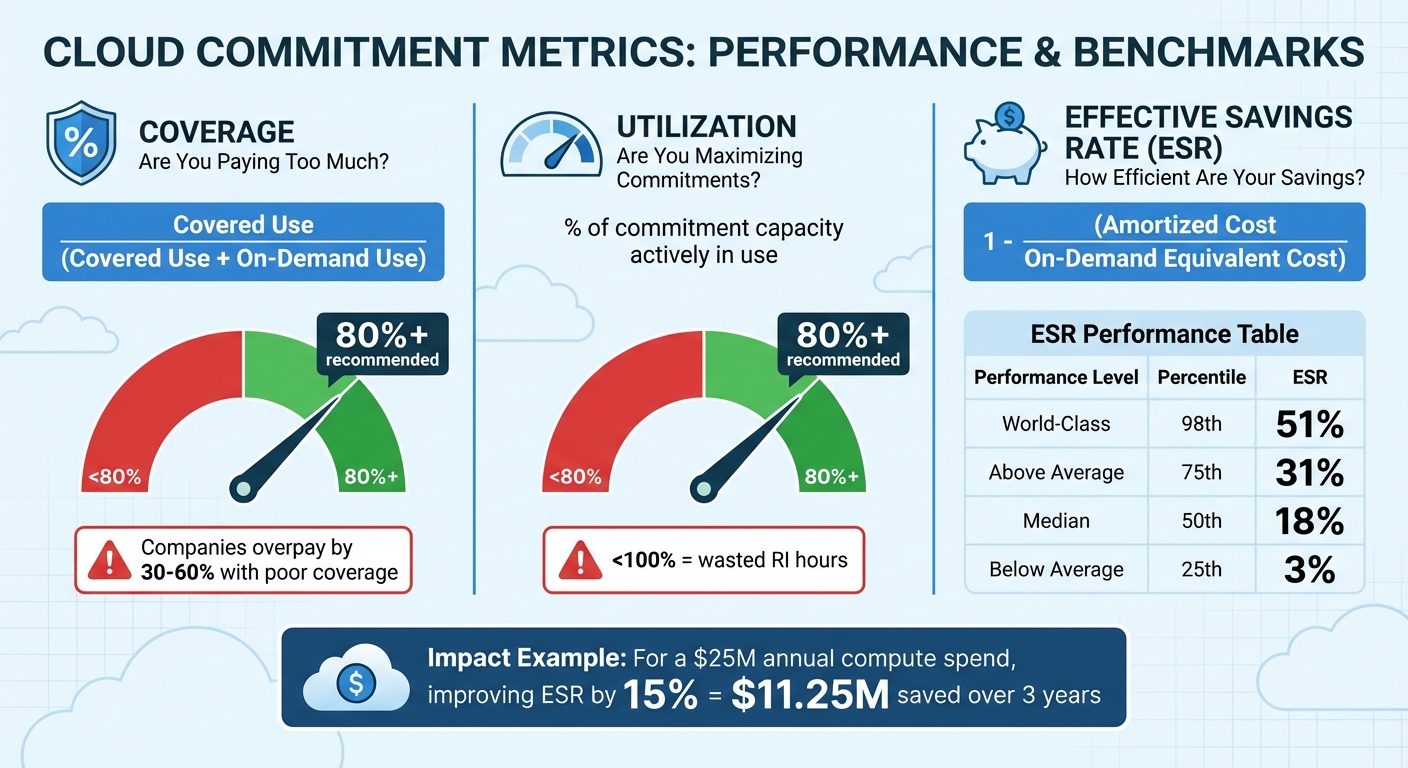
Coverage evaluates the percentage of your eligible compute usage that benefits from discounted commitments, like Reserved Instances (RIs) or Savings Plans, instead of being charged at full on-demand rates. The key question it addresses is: How much of my compute usage is protected by discounts?
If your coverage falls below 80%, it signals missed opportunities to save. Companies that don’t monitor their coverage often overpay by 30–60%. The formula is simple:
Covered Use / (Covered Use + On-Demand Use).
"The core question coverage analysis answers: ‘What percentage of my eligible compute hours are covered by commitments, and where are the gaps?’" – Nawaz Dhandala
Utilization: Are You Maximizing Your Commitments?
While coverage tells you if you’re buying enough commitments, utilization shows whether you’re actually using what you’ve purchased. It measures the percentage of your commitment capacity that’s actively in use. Falling below 80% utilization points to inefficiencies.
"If your utilization is less than 100%, it means you’ve paid for RI capacity that wasn’t matched by running instances, leading to ‘idle’ or ‘wasted’ RI hours." – Dnyaneshwar Bhosale, AWS Expert
Effective Savings Rate (ESR): How Efficient Are Your Savings?
ESR measures how much you’re saving compared to on-demand pricing. It’s calculated as:
1 - (Amortized Cost / On-Demand Equivalent Cost).
This metric is essentially the ROI of your cloud discount instruments, as described by the FinOps Foundation. The numbers tell a compelling story: while the median ESR is just 18%, top-tier organizations achieve 51%. Even with high coverage (e.g., 95%), poor utilization (e.g., 55%) can drag ESR down to 22%. For a company spending $25 million annually on compute, improving ESR by 15% could add $11.25 million in value over three years.
| ESR Performance | Percentile | Effective Savings Rate |
|---|---|---|
| World-Class | 98th | 51% |
| Above Average | 75th | 31% |
| Median | 50th | 18% |
| Below Average | 25th | 3% |
"Effective Savings Rate (ESR) … measures what matters: how much you’re saving versus on-demand prices. It distills down to a single outcome metric." – Shouri Thallam
Signals that Predict Waste in Cloud Commitments
This section dives into specific patterns that often signal waste in cloud commitments. Instead of waiting for budget overruns to hit, recognizing these patterns early can help you take proactive steps. A Commitment Risk Dashboard can highlight these inefficiencies in real-time, turning them into actionable insights. The three most common waste signals are underutilized services, expiring commitments, and regional imbalances.
Underutilized Commitments Across Services
One clear signal of waste is low utilization paired with high coverage. If your commitment utilization falls below 80%, you’re essentially paying for capacity you don’t use. This issue compounds when multiple services are affected – like idle EC2 instances, RDS databases with barely any connections over a week, or EBS volumes sitting in "available" instead of "in-use" states.
Hourly commitment rules make this problem worse. For instance, AWS Savings Plans apply on an hourly basis, so unused capacity in one hour doesn’t roll over to cover higher usage in another. If you’ve committed $2.45 per hour but only use 74% of that capacity, you’re wasting about $0.64 per hour – or roughly $5,606 annually per commitment. Research shows that 30-35% of cloud spending typically goes toward idle or unused resources. For a company spending $100,000 a month on AWS, that could mean $30,000 in waste.
To avoid this, size your commitments to align with your stable floor – the 10th percentile of historical usage. This way, every dollar committed is used, and you avoid over-committing. Next, let’s look at how expiring commitments can add to these inefficiencies.
Expiring or Misaligned Commitments
The "Commitment Cliff" is one of the most costly surprises in cloud management. When Reserved Instances or Savings Plans expire unnoticed, workloads shift to on-demand pricing, often causing a 40% cost increase in just one month.
Take the example of Lauren, a CFO at a mid-sized SaaS company. In late 2024, her company faced a sudden 40% spike in their cloud bill when $1.2 million worth of reserved instances expired in Q4 without being renewed. This oversight forced the team into a scramble to renegotiate commitments and realign their resources.
"When these commitments expire, any workloads tied to them revert to on-demand pricing, which can be exponentially higher. Without proactive cost monitoring, this transition often goes unnoticed until the cloud bill arrives." – Zack Liscio, Cloud Capital
To avoid this, set automated alerts at 60, 30, and 7 days before commitments expire. Conduct quarterly reviews to identify gaps and inefficiencies before they escalate. Organizations that involve Finance in cloud cost management report 77% confidence in COGS accuracy, compared to only 42% when Engineering handles it alone.
Regional and Instance Family Imbalances
Another common source of waste lies in where and what you’re running. Workloads without strict latency requirements often end up in high-cost regions unnecessarily, leading to inflated bills. Similarly, Reserved Instances locked to outdated instance families may no longer match your deployment footprint, leaving you with unused commitments.
In June 2022, Microsoft studied 188 first-party workloads (over 100,000 VMs) and found that workloads with P95 average CPU utilization below 25% could be moved to smaller VM types, saving significant capacity. They also identified "region-agnostic" workloads – those without specific latency or data-locality needs – that could be relocated to cheaper regions.
| Optimization Type | Signal of Inefficiency | Target Action |
|---|---|---|
| VM Rightsizing | P95 Avg CPU & Memory < 25% | Move to smaller instance family |
| Region-Agnostic | High cost in specific regions | Relocate to cheaper regions |
| Commitment Sizing | Utilization < 100% (e.g., 74.9%) | Reduce hourly commitment on renewal |
| Coverage Gap | Specific instance families on On-Demand | Purchase targeted RIs or Instance SPs |
| Data Transfer | High traffic between AZs or Regions | Optimize architecture to reduce DTO |
Another red flag is centralized savings imbalances. In larger organizations, one team may consume all the centralized savings from a Savings Plan, leaving other teams to pay full on-demand costs for their resources. This creates hidden inefficiencies – while the overall bill might look fine, individual teams end up overpaying.
"A misalignment between your application’s operational profile and your chosen pricing model can lead to significant cost overruns, eroding the very benefits you sought from the cloud." – Gaurav Raje, Author of Security and Microservice Architecture on AWS
Keep an eye out for uncovered instance classes – like RDS db.t3.micro – that remain on on-demand pricing while other commitments go underutilized. These imbalances highlight the need to rebalance your commitment portfolio across regions and instance families. Identifying these signals is the first step toward building a dashboard that can help reduce hidden costs.
Building a Commitment Risk Dashboard
Once you’ve identified waste signals, the next step is creating a dashboard that highlights these issues as they arise. A well-designed Commitment Risk Dashboard doesn’t just review past spending – it actively flags potential risks before they escalate. For SaaS and AI teams, this means combining cost data with usage metrics across various services and regions, while automating alerts for the most critical insights. Here’s how to tackle the tools, baselines, and integration strategies needed to turn raw data into actionable steps.
Tools to Monitor and Visualize Cloud Spending
Start with tools that centralize your spending data. Datadog Cloud Cost Management consolidates data from AWS, Azure, and Google Cloud, making it easier to identify underutilized resources. With daily updates, your dashboard stays current and actionable. AWS teams can also leverage AWS Cost Explorer, which offers native forecasting and natural language queries via Amazon Q Developer to speed up ad-hoc analyses.
A real-world example: In 2025, Cambia Health Solutions used Datadog’s Resource Catalog to optimize their Amazon RDS instances, boosting Reserved Instance utilization. This effort saved them $30,000 per month. The secret? They combined observability metrics (like CPU utilization) with billing data to identify instances operating at less than 10% CPU capacity, marking them for right-sizing.
For teams managing infrastructure as code, tools like Terraform can automate the provisioning of your dashboard and streamline data collection. This ensures your monitoring scales alongside your environment, preventing gaps in cost tracking.
Setting Baselines and Automating Alerts
To keep your dashboard effective, establish clear baselines for automated alerts. Organizations in the early "crawl" phase of FinOps should aim to cover 60% of eligible spend with commitment-based discounts, working up to 70% as they mature. Similarly, for cost allocation, start with 50% of spend correctly tagged, then push toward 80% as tagging practices improve.
Multi-threshold alerts are key for catching problems early. For example, configure AWS Budgets to notify teams at 50%, 75%, and 90% of actual spend, as well as 100% of forecasted spend. Anomaly detection tools can also flag unexpected cost spikes immediately. Imagine your AI inference workload shifts to on-demand pricing due to an expired Savings Plan – dimensional monitors can catch this within an hour and send alerts through Slack or Jira. Automating compliance checks for cost tagging (e.g., alerting if tagging accuracy drops below 80%) further ensures nothing slips through the cracks.
Integrating Costs and Waste Insights
The most effective dashboards compare on-demand costs with commitment costs by service or region. A "Savings Tracker" widget can calculate the difference between baseline on-demand rates and actual spend, helping quantify the return on your commitment strategy.
For AI teams, efficiency metrics like cost per AI inference can be reported to CloudWatch using AWS Lambda. This shifts the focus from total spend to workload efficiency, which is crucial for optimizing commitments tied to specific applications. Since over 80% of container spend often goes to idle resources, integrating container-level utilization data can uncover hidden inefficiencies.
Cost recommendations are another powerful tool. They can highlight idle load balancers, unattached disks, or outdated instance families that need upgrading. For example, switching from Amazon EBS gp2 to gp3 volumes can lower costs by 20%. Refresh these recommendations daily so engineers can act quickly. Some platforms even allow you to take direct actions, like deleting orphaned volumes or implementing rightsizing suggestions, straight from the dashboard’s interface. By merging cost and efficiency data, your dashboard becomes a bridge between insights and decisions.
| Metric | "Crawl" Phase (Beginner) | "Walk" Phase (Intermediate) |
|---|---|---|
| Cost Allocation Target | 50% of total spend | 80% of total spend |
| Commitment Coverage | 60% of eligible spend | 70% of eligible spend |
| Alerting Frequency | Monthly/Threshold-based | Real-time/Anomaly-based |
The ultimate aim is to make waste visible and actionable as it happens, turning early signals into meaningful cost savings.
TechVZero‘s Commitment Optimization Strategies
Spotting inefficiencies with your Commitment Risk Dashboard is just the first step. Turning those insights into real savings requires actionable strategies. For smaller SaaS and AI teams, this challenge isn’t just about visibility – it’s about tackling the hidden costs and structural inefficiencies often baked into traditional cloud commitments. TechVZero steps in to address these issues, transforming identified waste into meaningful cost reductions. Their approach works hand-in-hand with dashboard insights to actively reduce inefficiencies once they’re uncovered.
Bare Metal Kubernetes Migration for Cost Savings
A key part of TechVZero’s playbook is migrating workloads from managed cloud services to bare metal Kubernetes. Why? Because this shift eliminates the expensive abstraction layers that come with managed services while keeping reliability intact. The result? Teams can slash costs by 40–60% without sacrificing performance. It also resolves issues like regional or instance imbalances that can quietly eat into budgets.
For startup founders who have a basic understanding of infrastructure but don’t want to commit to hiring in-house experts, this model is a game-changer. By managing the full stack, TechVZero helps cut unnecessary expenses while keeping operations smooth.
Pay-for-Performance Model
TechVZero’s pricing model is as straightforward as it gets: they charge 25% of verified savings over one year – and if the minimum savings target isn’t met, you pay nothing. No upfront fees, no consulting charges. This structure ensures all the financial risk stays off your plate.
Case Study: Security and Savings Combined
In one standout example, TechVZero delivered a $333,000 savings in just one month while simultaneously stopping a DDoS attack. This case highlights how optimization doesn’t just save money – it can also bolster security. With experience operating at a scale of over 99,000 nodes, TechVZero brings enterprise-grade expertise to startups, making high-level optimization accessible without the need for a dedicated platform engineering team.
Conclusion: Taking Control of Cloud Spending
Turning metrics and waste signals into actionable strategies can lead to significant savings. For instance, optimizing cloud commitments can slash compute costs by 30–70%. Tools like a Commitment Risk Dashboard offer the clarity needed to achieve over 95% utilization with ideal coverage levels of 70–80%.
Top-performing teams treat cloud commitments like financial assets – they monitor, adjust, and align them with broader objectives. By reviewing 90 days of historical data, setting automated alerts for performance drops, and planning renewals well in advance, they distinguish strategic investments from unnecessary spending.
But spotting inefficiencies is only half the battle. Smaller SaaS and AI teams often face challenges acting on these insights without specialized engineering support. This is where TechVZero steps in, simplifying the process by migrating workloads to bare metal Kubernetes. By avoiding the added costs of managed service abstraction layers, teams can cut expenses by 40–60% while maintaining reliability.
TechVZero’s pay-for-performance model reduces financial risk even further. Their approach is simple: you pay 25% of verified savings over a year, and if savings don’t meet the minimum target, you pay nothing. No upfront costs, no consulting fees – just results that directly impact your bottom line.
If your dashboard highlights underutilized commitments, regional inefficiencies, or expiring terms, don’t let those signals go to waste. Take action, monitor closely, and work with experts to mitigate risks. This way, recurring cloud expenses can become predictable and manageable costs.
FAQs
What’s the fastest way to find underused RIs or Savings Plans?
To quickly pinpoint underused Reserved Instances (RIs) or Savings Plans, dive into detailed optimization reports. Pay close attention to metrics like utilization percentage, which can reveal idle commitments. Use tools or dashboards designed to highlight unused reservations and offer actionable suggestions – such as adjusting purchases, relocating resources, or canceling commitments. By keeping an eye on these metrics, you can swiftly identify and address underutilization, ensuring better resource efficiency.
How do I choose the right commitment size without overbuying?
To prevent overbuying, it’s important to take a close look at how you’re actually using your resources and leverage forecasting tools that rely on data. Here’s how you can approach this:
- Evaluate resource usage: Pinpoint areas where assets are underutilized or where you’ve allocated more capacity than necessary.
- Use predictive tools for forecasting: Model realistic scenarios to better understand future needs and avoid overspending.
- Track key metrics: Keep an eye on utilization rates and coverage to ensure your commitments match actual demand.
By following these steps, you can strike a balance between saving money and avoiding unnecessary waste.
What alerts should I set to avoid an RI or Savings Plan expiration spike?
To avoid unexpected cost increases when your Reserved Instances (RIs) or Savings Plans expire, it’s a good idea to set up alerts ahead of time. Schedule notifications for 1, 7, 30, and 60 days before expiration. You can configure these alerts directly within your cloud management console, specifying lead times and choosing who should receive them. Leveraging built-in tools or external monitoring features helps you stay on top of these timelines, giving you enough time to renew or adjust your commitments and sidestep any surprise expenses.