How Dependency Mapping Reduces Cloud Costs

Cloud costs are growing, and nearly 28% of spending is wasted. Dependency mapping can help you control these expenses by providing a clear view of how your resources interact. It identifies inefficiencies like unused storage, idle resources, and expensive traffic patterns. This approach goes beyond traditional cost tools by offering insights into resource dependencies, improving cost allocation, and optimizing usage.
Key Points:
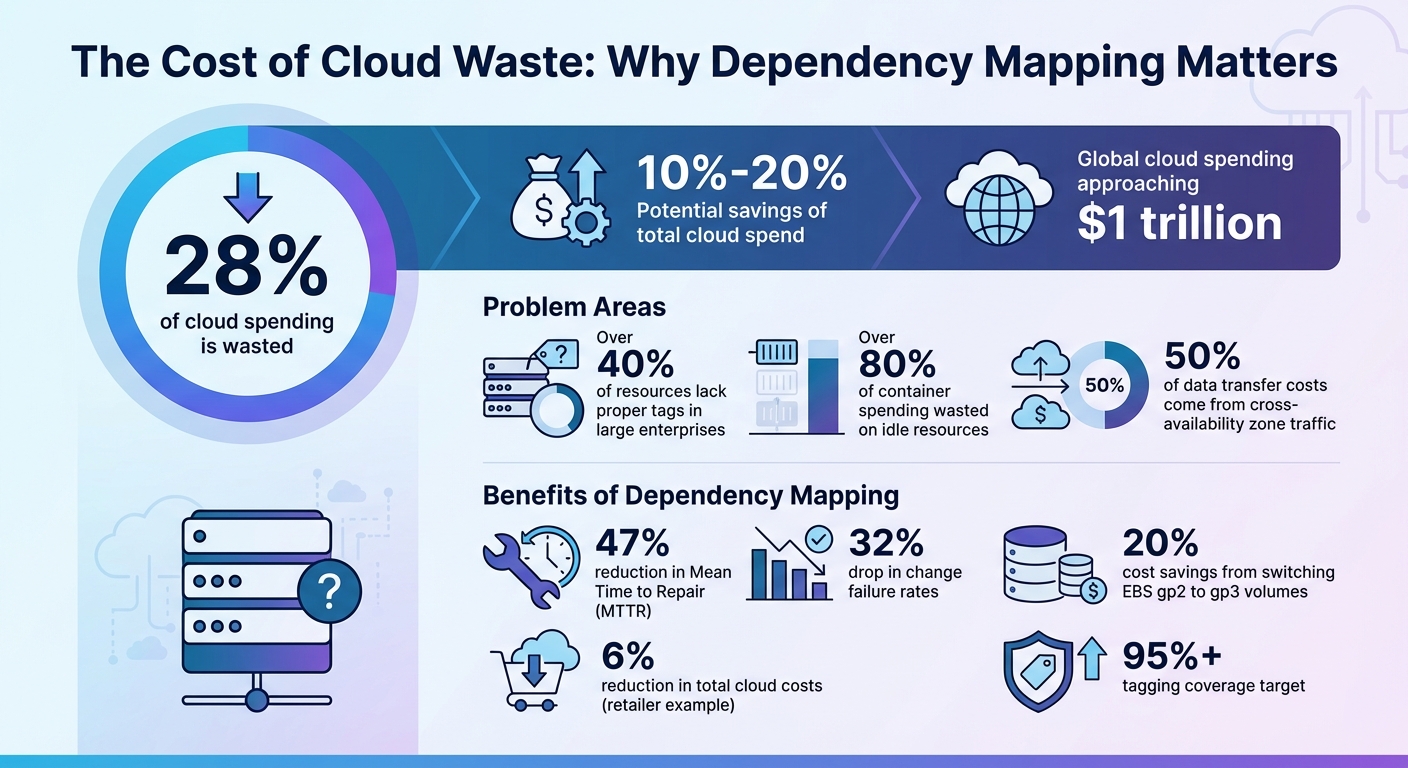
- 28% of cloud spending is wasted, with potential savings of 10%-20%.
- Dependency mapping tracks resource interactions using tools like eBPF and OpenTelemetry.
- It highlights unused resources, overprovisioned Kubernetes pods, and costly cross-zone traffic.
- Improves cost attribution by linking expenses to specific teams or applications.
- Helps optimize resource usage by aligning requests with actual needs.
Take action today by integrating dependency mapping into your workflow to cut waste, allocate costs effectively, and ensure smarter resource use.
Cloud Cost Waste Statistics and Dependency Mapping Savings Opportunities
What Tools Help With Cloud Dependency Checks?
sbb-itb-f9e5962
The Hidden Challenges of Cloud Cost Optimization
Understanding these challenges underlines the importance of dependency mapping to identify inefficiencies and reduce unnecessary spending.
Why Common Tools Miss the Mark
Most cloud cost management tools rely heavily on billing exports, such as AWS Cost and Usage Reports, Azure Enterprise Agreements, or GCP BigQuery. However, these tools often lack the architectural context needed to explain how resources interact with one another. They tend to view each resource in isolation, ignoring the complex dependencies that define modern cloud environments.
Tagging is often used to address cost attribution issues, but it’s far from a perfect solution. In large enterprises, over 40% of resources typically lack proper tags to indicate ownership or project alignment. Even when tags exist, inconsistencies in how they’re applied can make accurate cost allocation more of a guessing game. These shortcomings expose deeper dependency issues that contribute to rising cloud costs.
The visibility problem doesn’t stop there. Kubernetes’ layered architecture adds an extra layer of complexity. While standard tools can track cluster-level costs, they often fail to provide insights at the pod level. This lack of granularity hides inefficiencies, like overprovisioned resources that aren’t fully utilized, quietly inflating expenses over time.
How Complex Dependencies Escalate Costs
Microservices architectures, while efficient in many ways, create a tangled web of interconnected resources. The functionality of one service often depends on several others. When engineering teams retire a microservice, they can inadvertently leave behind unused infrastructure – such as unattached storage volumes, stale snapshots, idle load balancers, or elastic IPs with no associated instances. These "orphaned" resources continue to generate costs unnecessarily.
Another factor is the hesitation to delete seemingly idle resources. Engineers often avoid removing components for fear of disrupting critical production processes. Without a clear understanding of resource dependencies, teams tend to err on the side of caution, choosing to absorb the cost of waste rather than risk downtime.
Costs can also spiral in less obvious ways. For instance, cross-availability zone traffic accounts for a staggering 50% of all data transfer costs. These charges often go unnoticed during the initial design phase of an architecture. Additionally, microservices that communicate frequently across zones can rack up significant egress fees, which are typically lumped into broad "networking" cost categories. Even after teams address inefficiencies, waste can reappear in later development cycles if automated governance isn’t in place.
How Dependency Mapping Reduces Costs
Dependency mapping turns cloud cost optimization into a precise, data-backed process. By showing how resources are connected and interact, it uncovers inefficiencies that traditional billing tools often miss. This not only helps cut waste but also ensures accurate cost tracking and smarter resource use across your infrastructure.
Identifying and Eliminating Redundant Resources
Dependency mapping creates a clear picture of how resources interact, making it easier to spot what’s actively used versus what’s sitting idle. Orphaned resources – like unattached EBS volumes, unused elastic IPs, and idle load balancers – can quietly rack up charges long after their original services are gone.
On average, organizations waste 28% of their cloud spending, with potential savings of 10% to 20% left on the table. Dependency mapping helps teams safely retire redundant services by showing how failures in one area might affect the broader system, avoiding the dreaded "dependency hell". Beyond identifying orphaned resources, mapping tools also flag outdated technologies. For example, switching from Amazon EBS gp2 to gp3 volumes can cut costs by 20%. When paired with "FinOps as Code", mapping automates the detection and cleanup of forgotten items like stale snapshots or unallocated network interfaces.
Improving Cost Attribution and Allocation
Dependency mapping isn’t just about cutting waste – it also improves how costs are tracked and allocated.
One of its key strengths is linking cloud expenses to the teams and applications that actually use the resources. While traditional tagging methods often fall short due to inconsistent or missing tags, dependency mapping fills the gaps. It uses metadata from Configuration Management Databases (CMDB), resource configurations, and naming patterns to establish ownership, even when manual tagging is incomplete.
This enables accurate showback and chargeback, providing a clear trail from each resource to its functional owner. Organizations can define "Scopes" or "Cost Categories" to break down multi-cloud expenses by team, product line, environment, or business unit – without the hassle of manual reconciliation. In Kubernetes environments, mapping helps clarify shared costs by linking cluster usage to specific namespaces, deployments, or pods.
Dependency mapping also addresses "charge-back gaps", identifying which legacy systems were tied to orphaned resources. By connecting infrastructure usage to application-level performance, it allows organizations to shift their focus from total spend to unit economics – measuring costs like price per request or per active user.
Optimizing Resource Utilization
To reduce unnecessary spending, it’s crucial to align resource consumption with actual needs. Dependency mapping highlights the gap between what teams request and what they actually use. For example, comparing resource requests to p95 usage can reveal services that are over-provisioning CPU or RAM. This is especially relevant in Kubernetes environments, where over 80% of container spending is wasted on idle resources.
Mapping also uncovers inefficiencies in service-to-service communication. For instance, it can reveal cases where a single request triggers excessive downstream calls. It supports strategies like bin packing, which consolidates pods onto fewer, larger nodes to increase efficiency and reduce idle overhead. Additionally, tools like Vertical Pod Autoscaler (VPA) can adjust pod resource requests based on historical usage patterns.
Dependency mapping shines a light on opportunities to consolidate or schedule workloads more efficiently. For example, non-production microservices can be automatically shut down during nights and weekends to save costs. It also identifies cross-availability zone traffic, which accounts for 50% of all data transfer fees. By restructuring deployments, teams can cut these costs without compromising reliability.
Implementing Dependency Mapping for Scalable Cost Savings
Dependency mapping serves as a continuous system to pinpoint inefficiencies, allocate costs accurately, and curb overspending. By linking technical insights with financial operations, it becomes a valuable tool for achieving scalable cost savings.
Choosing the Right Dependency Mapping Approach
The first step is deciding between agent-based and agentless mapping. Agent-based solutions, like OpenTelemetry, provide deep insights into service communication at the code level. They capture runtime behavior with precision but require extra instrumentation and consume more resources.
On the other hand, agentless solutions – using tools like eBPF (e.g., Cilium, Pixie) or analyzing Infrastructure as Code (IaC) tools like Terraform and Helm – offer quicker implementation. These are great for initial discovery and high-level cost allocation but might miss dynamic or unmanaged resources. For fast-paced SaaS and AI teams, eBPF tools strike a balance, offering visibility into service interactions without the need for manual setup.
To maximize results, consider combining multiple approaches: use eBPF for real-time traffic analysis, service meshes like Istio for communication patterns, and IaC tools for understanding intended architecture. Store this data in a graph database (e.g., Neo4j or Amazon Neptune) enriched with metadata tags like ownership, purpose, service-level agreements (SLAs), business importance, and cost-related tags (cost_center, application, lifecycle_status). These insights can anchor dependency mapping in your broader FinOps strategy.
Integrating Dependency Mapping into FinOps Strategies
To unlock its full cost-saving potential, embed dependency mapping into your FinOps framework for ongoing resource optimization. Automate updates by integrating mapping into your CI/CD pipeline, ensuring maps refresh with every deployment. Use traffic validation tests to confirm dependencies are accurate and functioning as expected.
Link dependency data to billing sources such as AWS CUR, Azure EA, or GCP BigQuery to analyze unit economics – metrics like cost per vCPU hour or API call. This allows teams to shift discussions from broad spending figures ("we spent $50,000 this month") to actionable insights ("our cost per transaction rose 15% without a traffic increase").
Implement policy-as-code to avoid costly mistakes before they occur. Start with a small set of policies (10-15) targeting high-risk areas, such as blocking untagged resource deployments, flagging workloads exceeding budget thresholds, or preventing Reserved Instance purchases for services marked as retiring in your dependency map. For example, in early 2025, a global retailer applied this method to automate rules based on utilization metrics, shutting down non-production servers during off-peak hours. The result? A 6% reduction in total cloud costs.
"Governance isn’t the audit log. It’s the runtime." – Mike Fuller
Metrics and Goals to Track
To measure the impact of dependency mapping, establish metrics that reflect operational improvements. Start by using automated tools to capture current traffic patterns, focusing on costly areas like cross-Availability Zone and cross-region traffic. Then define clear success benchmarks. Monitor unit economics (e.g., cost per user session or cost per GB stored) to connect spending with business outcomes. Set variance thresholds and configure alerts for spending increases of 10-15% per application or service. Aim for over 95% tagging coverage, using dependency mapping to infer ownership for untagged resources by analyzing their connections to known services.
Prioritize optimization efforts using a criticality score, which multiplies the number of dependent services by their business importance. This helps focus on areas with the highest impact. Track operational metrics as well – mature implementations of dependency mapping have shown a 47% reduction in Mean Time to Repair (MTTR) and a 32% drop in change failure rates. Before purchasing Reserved Instances or Savings Plans, consult your dependency map to avoid committing resources to workloads slated for retirement.
Keep a close eye on spend-to-usage drift to differentiate between price changes and scaling events. For AI companies, this is especially important for GPU usage, where aggressive scaling without proper tagging can lead to significant untracked expenses.
Conclusion
Dependency mapping takes cloud cost management to the next level by turning static spending reports into dynamic insights about how services, infrastructure, and applications interact. This approach shines a light on hidden inefficiencies, like orphaned resources, redundant services, and traffic patterns that drain budgets unnecessarily.
Key Takeaways
With global cloud spending approaching $1 trillion and nearly 28% of that going to waste, dependency mapping offers a smarter way to manage costs. By focusing on actionable insights and unit economics, businesses can ensure every dollar spent ties back to meaningful outcomes.
The technical advantages are just as compelling. For example, dependency mapping can prevent expensive missteps, such as purchasing Reserved Instances for services nearing end-of-life or resizing resources without considering downstream impacts. Even when tagging is incomplete, the relationships between resources can still provide a clear picture of costs, enabling full allocation. Companies that adopt these strategies often see quick wins – like Skyscanner, which identified enough savings in just two weeks to cover a year’s subscription to their cost intelligence platform.
These benefits set the stage for impactful, ongoing improvements.
Next Steps for SaaS and AI Companies
To start, focus on auditing your highest-cost services. Use observability tools to map dependencies, uncover traffic inefficiencies, and understand how resources are connected. This will help you pinpoint where money is being wasted.
Make dependency mapping a part of your deployment workflow, ensuring maps automatically update with every change. Link this data to your billing systems – whether it’s AWS CUR, Azure EA, or GCP BigQuery – to calculate the metrics that matter most to your business. Finally, set up a weekly review process to identify and address cost anomalies before they escalate. The architecture you build today will define your efficiency tomorrow.
FAQs
What makes dependency mapping different from traditional cloud cost management tools?
Dependency mapping digs into the connections between your applications, services, databases, and infrastructure. It lays out these relationships visually, making it easier to spot hidden inefficiencies. For example, you might uncover an underused service that’s keeping an expensive database active or a cascading chain of waste caused by over-provisioning a single component. This approach helps explain the “why” behind the way resources are being used.
In contrast, traditional cloud cost management tools focus on the “how much” by tracking usage, setting budgets, flagging anomalies, and breaking down costs. While they’re great for financial reporting, these tools often look at resources as standalone elements, missing the bigger picture of how they interact within a system.
By combining dependency mapping with traditional cost management tools, engineering-savvy founders at TechVZero can zero in on inefficiencies at their core. This allows them to not only identify waste but also understand its financial impact, leading to smarter and more effective cloud optimization strategies.
What are the advantages of using agent-based versus agentless dependency mapping?
Agent-based dependency mapping involves installing lightweight software directly on each host. This method offers deep visibility into operating systems, applications, and virtualization layers. It enables precise monitoring, automation, and actionable insights – making it a great choice for engineering teams that require detailed tracking of resources and the ability to quickly address anomalies that might lead to increased cloud costs.
In contrast, agentless dependency mapping skips software installation altogether, relying instead on APIs and network protocols to gather data remotely. This makes it ideal for swiftly mapping multi-cloud environments and cloud-native services with minimal effort and overhead. It’s especially useful for SaaS and AI teams looking to manage costs while maintaining broad visibility across complex cloud setups.
How does dependency mapping help large enterprises manage cloud costs more effectively?
Dependency mapping creates a detailed, machine-readable graph that illustrates how applications, services, databases, and infrastructure components interact. By clarifying these connections, teams can directly link cloud spending to specific business units or teams, instead of treating costs as vague, anonymous entries on cloud bills. This approach promotes better cost attribution and accountability.
When paired with consistent tagging and labeling, dependency mapping enables organizations to allocate costs more precisely to products, teams, or departments. This level of detail not only highlights inefficiencies, like idle resources, but also supports accurate charge-back or show-back reporting. The result? Reduced waste, smarter resource usage, and cloud spending that aligns closely with business goals.
At TechVZero, we recommend combining dependency mapping with regular usage analysis to create a continuous feedback loop between engineering and financial decisions. This ensures every dollar spent on cloud services is trackable, optimized, and contributes to business growth.