DevOps ROI: Metrics for AI Companies
Calculating DevOps ROI for AI companies boils down to one formula: (Gain – Cost) / Cost × 100. "Gain" includes faster delivery, reduced costs, and higher revenue from AI-driven products. "Cost" factors in GPU/TPU usage, storage, and service fees. Yet, only 51% of organizations measure AI ROI accurately, risking inefficiencies.
Key metrics to track include:
- DORA Metrics: Deployment Frequency, Lead Time for Changes, MTTR, and Change Failure Rate.
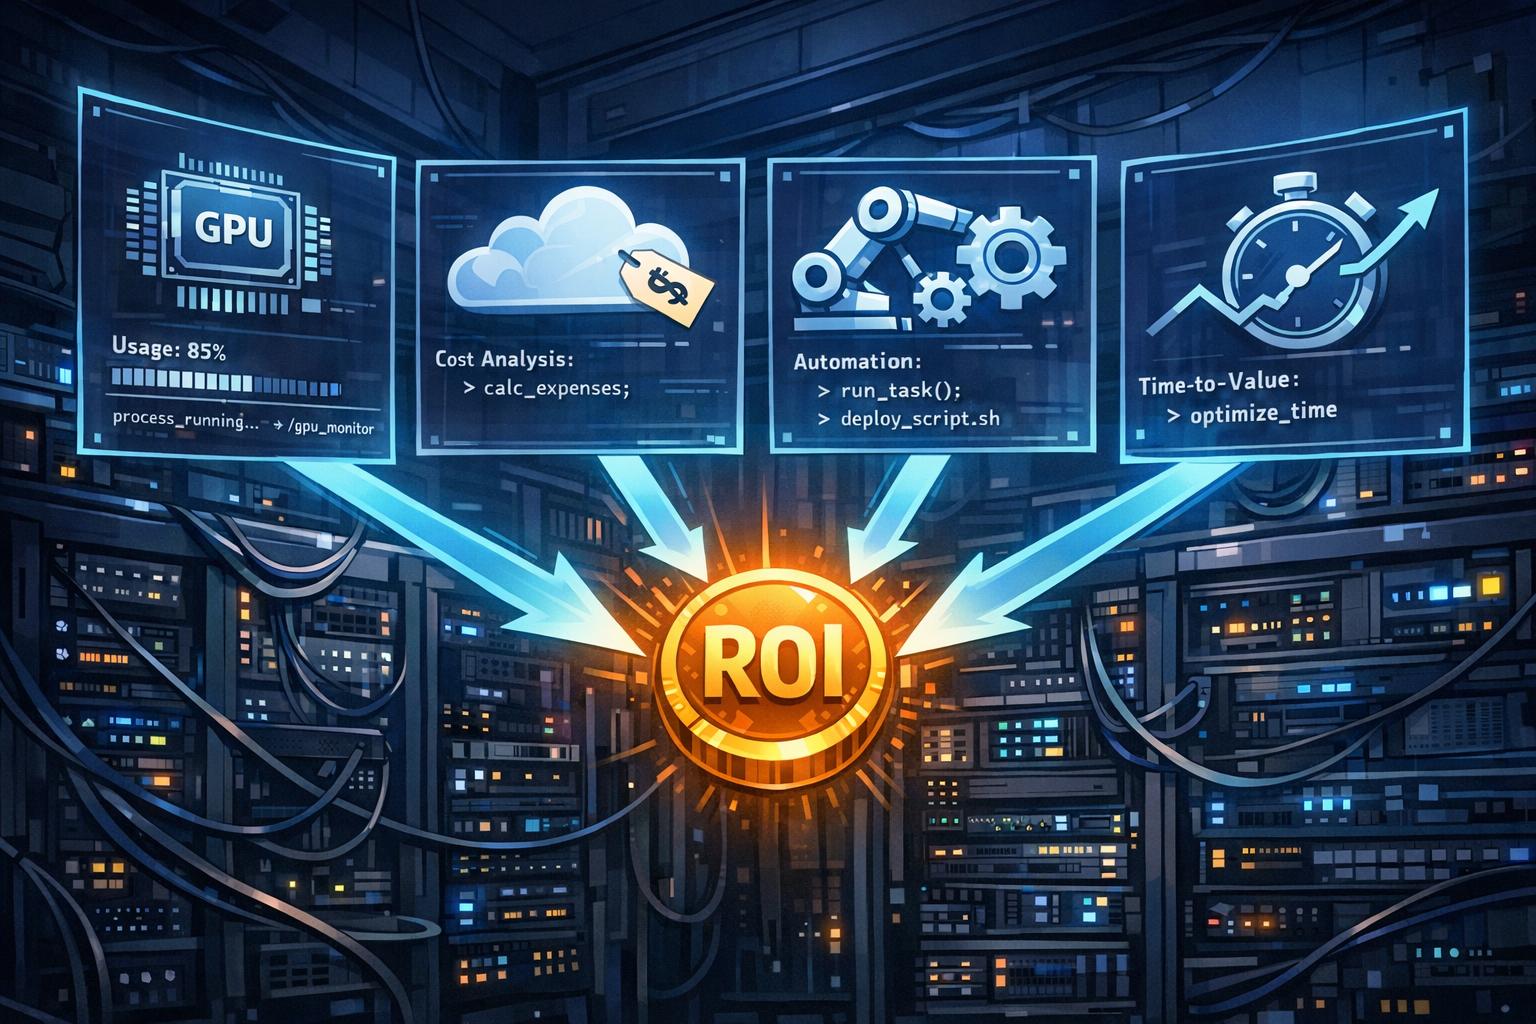
- AI-Specific Metrics: GPU/TPU utilization, cloud unit costs, automation rates, and time-to-value for AI features.
For example, optimizing GPU use can save up to 70% in costs, while automation boosts delivery speed and reduces manual effort. Companies like Booking.com and PayPal have seen measurable improvements in speed and cost by adopting these strategies.
The takeaway? Align technical metrics with business outcomes. Track costs, speed, and stability to ensure AI investments deliver real financial returns.
ROI of DevOps Transformation (Google’s Dora Research)
Core DevOps Metrics for Assessing ROI in AI
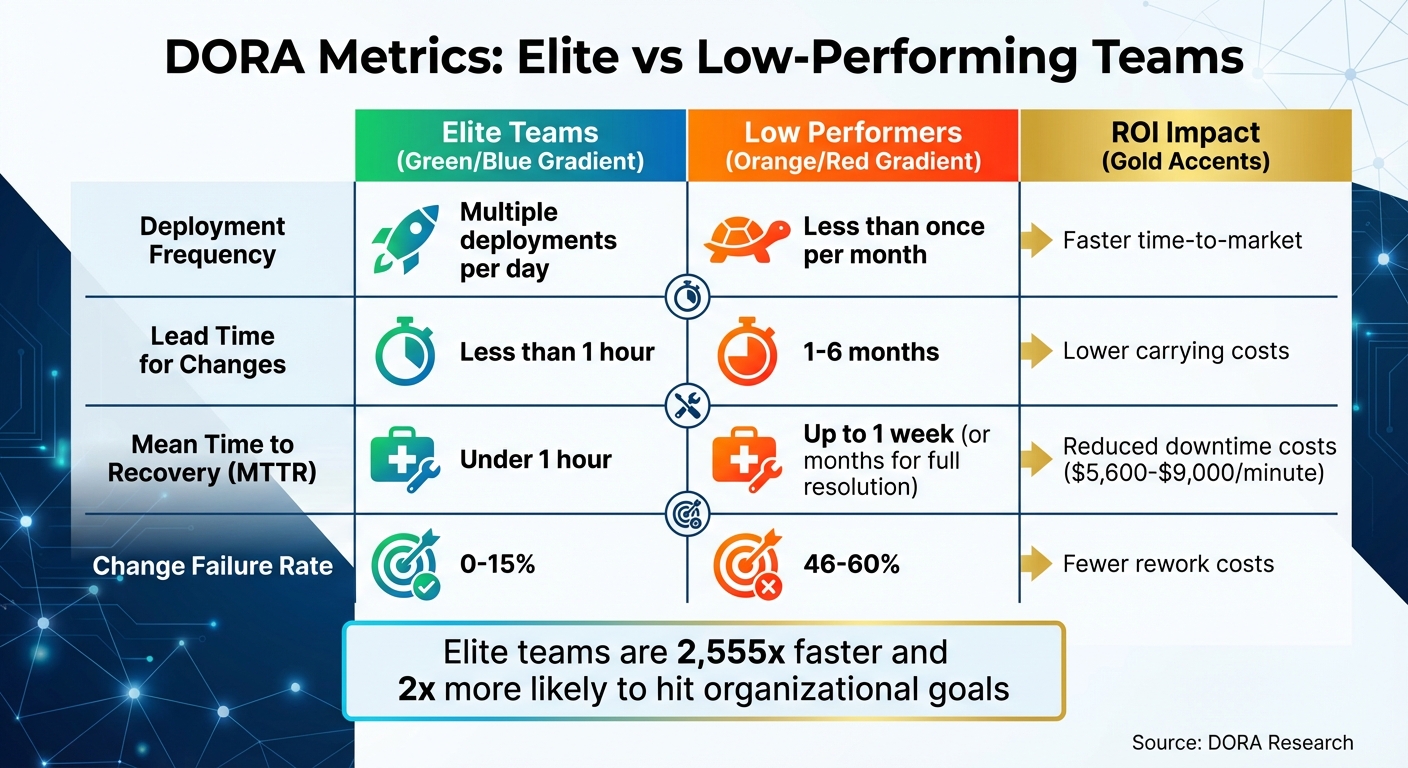
DORA Metrics Performance Benchmarks: Elite vs Low-Performing DevOps Teams
The four key DORA metrics – Lead Time for Changes, Deployment Frequency, Mean Time to Recovery (MTTR), and Change Failure Rate – offer a clear way to measure the return on investment (ROI) in DevOps practices. These metrics help determine whether your engineering efforts are speeding up delivery or just adding costly complexity. For AI companies juggling model pipelines and operational costs, these metrics directly translate into savings and revenue growth.
Top-performing teams achieve multiple deployments per day and can push changes to production in under an hour. On the flip side, struggling teams may deploy less than once a month, with lead times stretching beyond six months. This isn’t just about speed – high performers are twice as likely to hit organizational goals, turning technical efficiency into tangible business outcomes.
Lead Time for Changes
This metric measures how long it takes for a code change to move from commit to production. For AI companies, it reflects how quickly updates – whether model improvements, bug fixes, or new features – reach users. As the DX Blog puts it:
"Lead time for changes is more than just a process metric. It reflects how quickly engineering organizations can respond to customers, adapt to market shifts, and deliver business value".
Shorter lead times mean faster delivery of improvements to users. AI tools are making a real impact here, cutting lead times by 20-30% by automating repetitive coding tasks. For example, in 2025, Booking.com implemented generative AI tools for over 3,500 engineers, boosting delivery throughput by 16%. Similarly, Intercom nearly doubled its AI adoption among engineers, achieving 41% time savings in development.
To optimize lead times, focus on smaller, more frequent updates. Deploying smaller batches of AI model changes reduces delays. However, AI’s speed in generating code can sometimes tempt teams to skip these smaller updates, which can lead to a 7.2% drop in delivery stability if not managed carefully. Keep a close eye on both speed and quality to avoid hidden issues.
Deployment Frequency
Deployment Frequency measures how often your organization successfully pushes changes to production. For AI companies, frequent deployments enable rapid experimentation, quicker feedback on model performance, and faster responses to market needs. Jesse Sumrak from LaunchDarkly explains:
"High-performing DevOps teams often achieve multiple deployments per day… The aim is to move towards more frequent, smaller deployments rather than large, infrequent releases".
Take Jackpocket, for example. In 2024, this mobile gaming and lottery platform went from 3 deployments per month to daily deployments, cutting deployment incidents by 90% and reducing recovery time from 30 minutes to under 10 minutes. Similarly, Paramount increased deployment frequency from twice a month to 6-7 times per day, slashing bug fix times from a week to just a day.
One key strategy is decoupling deployment from release. By using feature flags, teams can deploy code without immediately activating unfinished features. This approach is especially useful for AI workloads, where models often need testing in production environments before a full rollout.
Mean Time to Recovery (MTTR)
MTTR measures how quickly you can restore service after a production failure. For AI companies, this metric is directly tied to revenue, as unplanned downtime can cost between $5,600 and $9,000 per minute. Quick recovery times are essential for minimizing financial impact.
Failures are inevitable in AI systems, making MTTR a critical focus. Tom Hall, DevOps Advocate at Atlassian, explains:
"The focus on MTTR is a shift away from the historical practice of focusing on mean time between failures (MTBF). It reflects the increased complexity of modern applications and thus, an increased expectancy of failure".
Elite teams can recover in under an hour, while low performers may take months to fully resolve incidents. In 2025, Onefootball adopted Kubernetes and New Relic for observability, cutting incidents by 80% and reclaiming 40% of developer time previously spent on manual troubleshooting.
Effective strategies include using feature flags as "kill switches" to disable problematic features instantly, automating root cause analysis with AI-driven tools, and maintaining standardized incident playbooks. For AI systems operating in hybrid cloud environments, automated anomaly detection across logs and metrics can significantly speed up issue resolution.
Change Failure Rate
This metric tracks the percentage of deployments that result in production failures requiring fixes or rollbacks. It serves as a counterbalance to deployment speed, ensuring that a push for rapid experimentation doesn’t compromise stability. Atlassian puts it this way:
"Change failure rate is a countermeasure to frequency and speed. Understanding the severity and frequency of those issues helps DevOps teams measure stability against speed".
High-performing teams keep their Change Failure Rate between 0-15%, while low performers deal with rates as high as 46-60%. The difference often comes down to practices like automated testing, test-driven development, and gradual rollouts such as canary releases, which expose new AI models to a small subset of users first.
For example, Booking.com implemented a balanced measurement framework to track both AI usage and DORA metrics, ensuring that speed improvements didn’t come at the expense of quality. Automated quality gates, like test suites that catch issues before deployment, are essential for protecting revenue and maintaining customer trust.
These core metrics not only measure DevOps success but also lay the groundwork for AI-specific metrics that can further enhance ROI.
AI-Specific DevOps Metrics to Maximize ROI
To address the unique challenges of machine learning workloads, AI companies need metrics that go beyond standard DevOps practices. While DORA metrics provide a strong base, AI-specific measures are essential for tackling the high costs and performance demands of GPUs and TPUs. These metrics help pinpoint inefficiencies and directly link performance improvements to revenue growth. Below are key metrics tailored for AI-driven operations.
Cloud Unit Cost
Cloud unit cost measures infrastructure spending per unit of work – whether that’s a prediction, training session, or user interaction. For AI companies, this metric uncovers inefficiencies in GPU and TPU usage, which can significantly inflate costs.
Breaking down total cost of ownership (TCO) into categories like model serving, training, hosting, storage, and operational support can reveal areas of waste. Debo Ray, Co-Founder and CEO of DevZero, highlights the issue:
"GPU waste represents the systematic underutilization of expensive resources in Kubernetes clusters… typically burning through tens or hundreds of thousands of dollars".
One AI startup slashed its GPU fleet from 120 to 45 units over three months by boosting utilization from 22% to 68%. This move reduced monthly costs from $420,000 to $145,000, achieving an 18x first-year ROI. By analyzing peak memory usage over 7–14 days, they matched workloads to appropriate GPU SKUs – for instance, moving a 58GB workload from an H100 to an A100-80GB saved 45% in monthly expenses.
Another cost-saving tactic involves using Multi-Instance GPU (MIG) technology to split large GPUs like H100s into smaller, isolated units. This allows multiple smaller services to share a single GPU, cutting costs by as much as 86%. For training tasks, enabling checkpoint/restore capabilities makes it possible to use spot instances, which are 60–80% cheaper than on-demand instances. Without checkpointing, interruptions can inflate training costs by more than 80%.
GPU/TPU Utilization Rates
Tracking utilization rates helps ensure expensive hardware is actively working rather than sitting idle. For GPUs, key metrics include GPU Compute Utilization (DCGM_FI_DEV_GPU_UTIL), which measures how often kernels are executing, and GPU Memory Utilization (DCGM_FI_DEV_FB_USED), which tracks VRAM usage. High memory usage with low compute activity often signals wasted resources.
For TPU workloads, High Bandwidth Memory (HBM) usage is critical, as large language models often hit memory bottlenecks rather than compute limits. Server-level metrics like Queue Size (pending requests) and Batch Size (requests being processed) are also vital for balancing throughput, latency, and cost.
On average, GPU-enabled Kubernetes clusters operate at just 15–25% utilization. For example, a 50-GPU cluster running at 20% utilization could waste over $200,000 annually. Raising utilization to 60–70% can cut monthly costs by 40–70%. One enterprise ML platform improved utilization from 19% to 74% by automating checkpointing and switching from 200 on-demand GPUs to a mix of 75 on-demand and 125 spot GPUs. This shift reduced monthly costs from $720,000 to $220,000, saving $500,000 while also speeding up training by 60%.
Using Horizontal Pod Autoscaling (HPA) to target 70% GPU utilization can optimize costs during low-traffic periods. Time-based scaling, such as reducing replicas during off-hours, can lower overnight GPU usage by up to 58%. Additionally, monitoring non-GPU resources like CPU and RAM – often wasted at rates of 75–85% in GPU instances – can further improve efficiency.
Automation Rate in MLOps
This metric measures the extent of automation in machine learning workflows, spanning CI/CD pipelines, data collection, model retraining, and deployment. High automation rates reduce manual effort, enabling smaller teams to deliver updates more frequently and focus on innovation.
Organizations that adopt DevOps and MLOps practices deploy software 200 times more often and recover from incidents 24 times faster than those that don’t. Automated pipelines significantly shorten delivery cycles, allowing teams to release updates in weeks instead of months – creating more opportunities to add value.
In November 2023, PayPal shared how AI-driven automation improved fraud detection. By deploying transformer-based deep learning models within 2–3 weeks, PayPal reduced fraud losses by 11% in Q2 2023. Between 2019 and 2022, as payment volumes nearly doubled to $1.36 trillion, the company also halved its loss rate.
Automation can also slash idle resource costs by up to 70%. For example, using small, purpose-built language models for performance monitoring can reduce expenses by 97% compared to larger models like GPT-4. Additionally, automating policy compliance through CI/CD pipelines generates audit logs instantly, cutting regulatory risks.
Time-to-Value (TTV) for AI Features
Time-to-Value measures how quickly an AI model moves from training to production and starts generating revenue. Shortening TTV helps companies stay competitive and capture revenue faster by enabling quicker experimentation and feedback on model performance.
Even a 5% improvement in model accuracy can significantly boost revenue retention. Automated MLOps pipelines that trigger retraining only when performance drops help avoid unnecessary resource use while maintaining quality.
In March 2024, a study in the American College of Radiology journal highlighted an AI-powered diagnostic platform that automated workflows in U.S. hospitals. Over five years, the platform achieved a 451% ROI, which jumped to 791% when factoring in radiologist time savings and additional revenue from follow-up procedures.
Features like automated rollbacks and canary deployments ensure that failed updates don’t derail progress, preserving momentum even during setbacks. AI-informed KPIs align technical performance with business outcomes, amplifying value creation fivefold.
sbb-itb-f9e5962
Calculating and Benchmarking ROI in AI DevOps
Using Financial Metrics for ROI
The formula for calculating ROI in DevOps is simple: (Gain – Cost) / Cost, expressed as a percentage. This approach pairs financial insights with the technical metrics discussed earlier, offering a comprehensive view of ROI in AI-driven DevOps environments. For AI companies, "Gain" includes savings from reduced downtime, optimized GPU expenses, and revenue from faster feature rollouts. On the other hand, "Cost" covers licenses, staffing, and training expenditures.
To evaluate long-term value, tools like Net Present Value (NPV), Internal Rate of Return (IRR), and Payback Period are essential. NPV projects total savings and revenue over several years, factoring in the high upfront costs of GPUs or TPUs. IRR helps compare the returns from DevOps investments against other capital projects, and the Payback Period highlights how quickly cumulative savings offset the initial investment.
In the first year, DevOps ROI often falls between 20% and 30%, but mature implementations can exceed 100%. Financial benefits for large organizations can range from $10 million to $259 million annually, with ROI becoming evident within 6 to 12 months of implementation.
Key drivers include faster deployment cycles, which enable earlier product launches and revenue gains, and lower change failure rates, which reduce emergency fixes and associated costs. Both "hard" metrics, like cost reductions, and "soft" metrics, such as improved developer morale and retention, play a role in long-term productivity and ROI.
These financial measurements establish a solid foundation for setting performance benchmarks, which we’ll explore next.
Benchmarking Key Metrics
Turning financial outcomes into measurable operational improvements starts with effective benchmarking. Before implementing DevOps changes, gather data on current performance metrics like deployment speed, recovery times, failure rates, and infrastructure costs. This creates a baseline to measure progress. Without these benchmarks, it’s impossible to gauge the true impact of your efforts.
The DORA metrics framework is a widely recognized standard for benchmarking. Elite teams, for example, deploy updates multiple times daily with lead times of under an hour – making them up to 2,555 times faster than lower-performing teams, which may take months. These top-performing teams also recover from failures in under an hour, compared to up to a week for their counterparts, and maintain failure rates between 0% and 15%.
The table below highlights how these benchmarks align with both financial and operational improvements:
| Metric Category | Current State | Target State | ROI Impact |
|---|---|---|---|
| Deployment Frequency | Monthly or Yearly | Multiple times per day | Faster time-to-market |
| Lead Time for Changes | 1–6 Months | Less than 1 hour | Lower carrying costs |
| Mean Time to Recovery | Up to 1 week | Less than 1 hour | Reduced downtime costs |
| Change Failure Rate | High/Unpredictable | 0–15% | Fewer rework and hotfix costs |
| Infrastructure Spend | Manual/High Waste | Automated/Optimized | Direct operational savings |
Regular reviews – quarterly or biannual – are crucial for tracking progress against these benchmarks and refining targets as your system evolves. Use automated monitoring tools to collect real-time data instead of relying on one-off snapshots. If a specific automation tool doesn’t improve your metrics within 6 to 12 months, consider discontinuing it to protect your ROI.
TechVZero Strategies for Optimizing DevOps ROI
TechVZero has developed advanced strategies to maximize ROI by focusing on critical DevOps metrics and cost benchmarks. Here’s how they do it:
Bare Metal Kubernetes Migrations
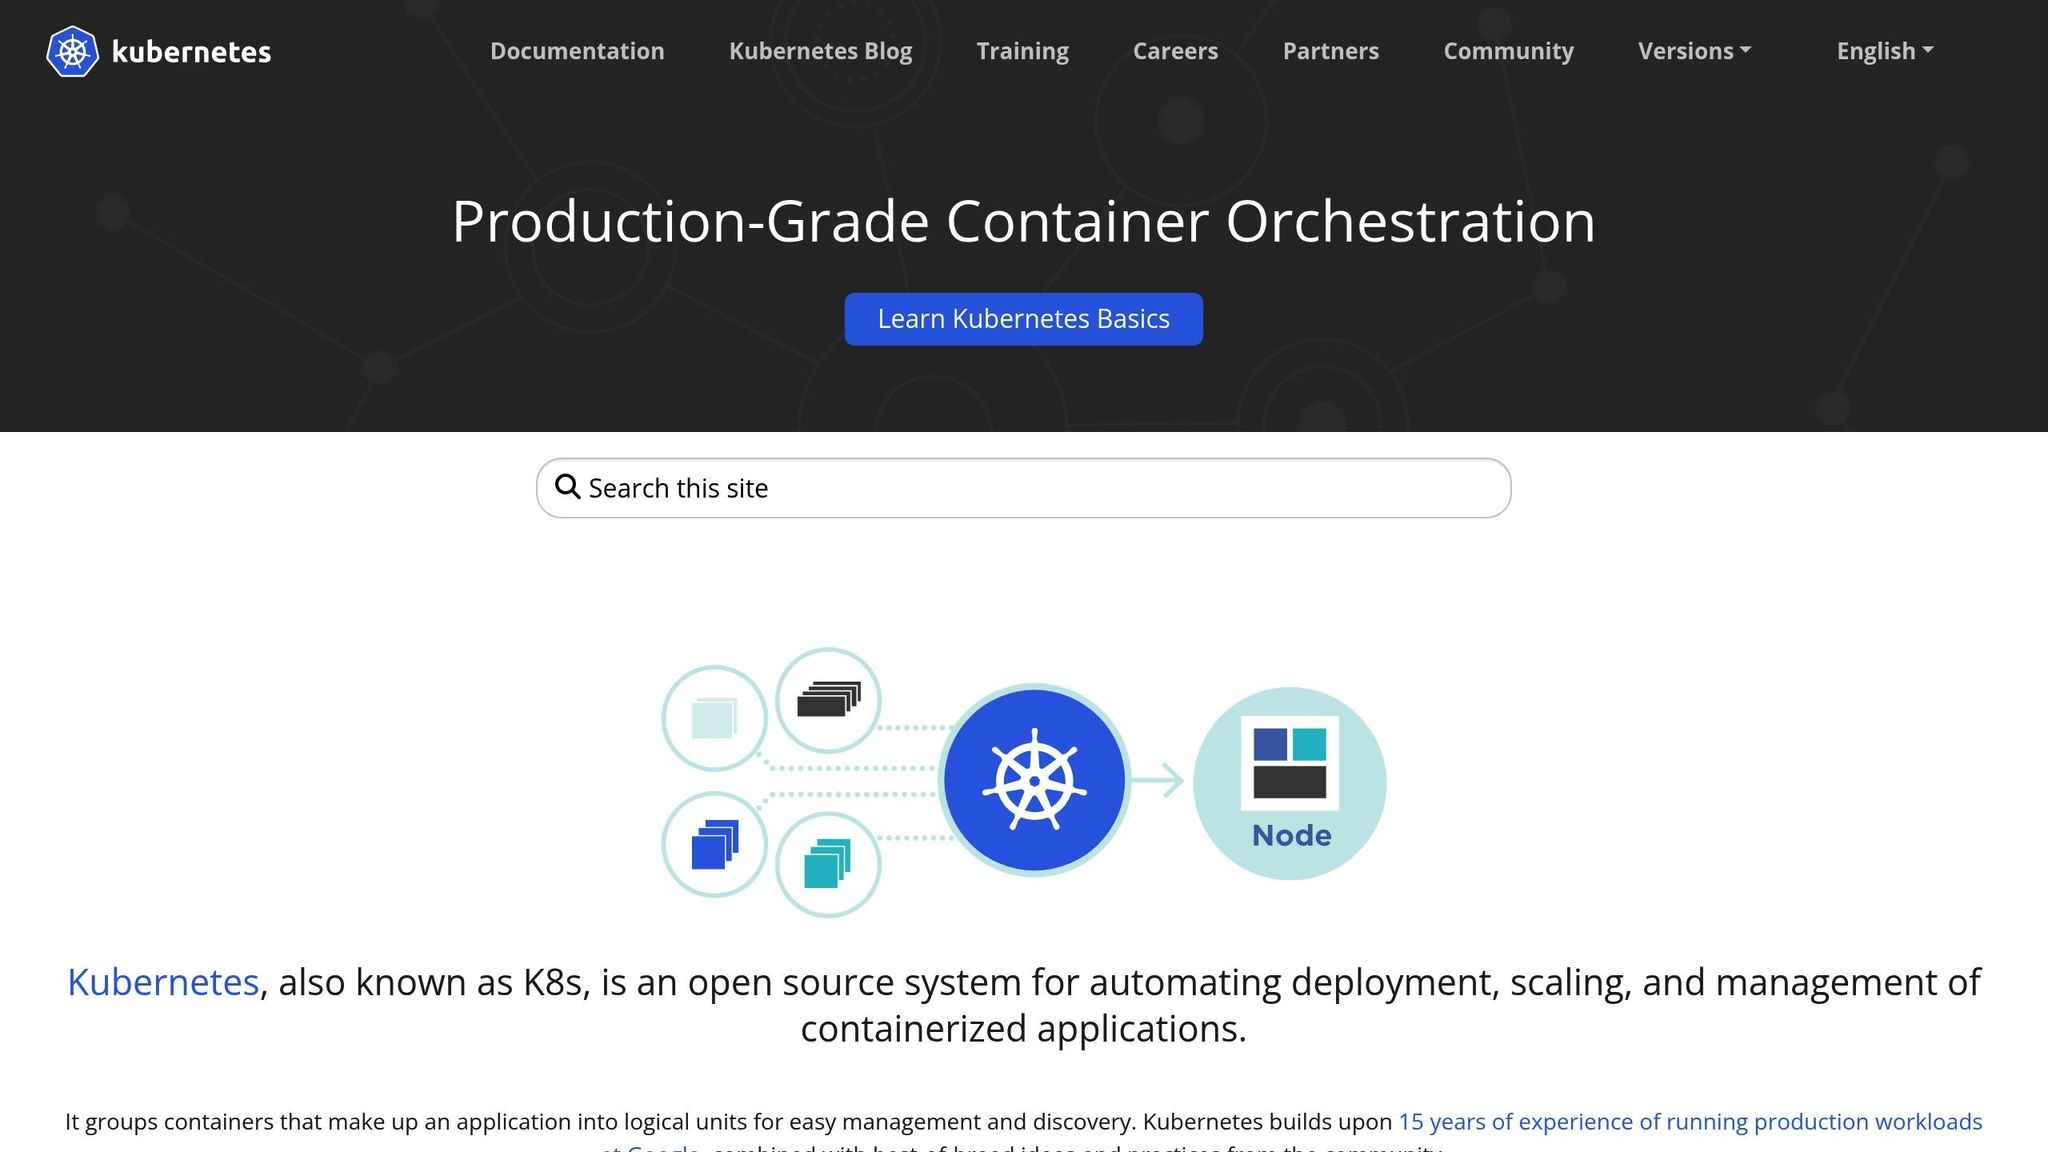
Migrating AI workloads to bare metal infrastructure can slash costs by 40-60%, primarily by cutting out the extra expenses tied to managed services and virtualization. This reduction in total expenditures directly improves ROI, as calculated by the formula: (Net Benefits / Total Expenditures) × 100.
For companies running GPU or TPU workloads, bare metal setups also deliver superior performance compared to virtualized environments. This improvement accelerates the Time-to-Value for launching new features, giving businesses a competitive edge.
And it scales. TechVZero has successfully managed systems with 99,000+ nodes, proving that bare metal doesn’t compromise stability for savings. Before migrating, it’s essential to establish baseline metrics – such as current cloud spending, deployment frequency, and MTTR (Mean Time to Recovery) – to measure the migration’s actual impact. Rather than evaluating individual deployments, TechVZero recommends treating migration as a broader initiative across your entire AI portfolio.
This strategy aligns with TechVZero’s overarching goal of reducing costs while enhancing performance in AI DevOps.
Case Study: $333,000 Saved in One Month
In one standout example, TechVZero helped a client save $333,000 in just one month while simultaneously stopping a DDoS attack. The team used automated discovery tools to pinpoint inefficiencies, such as over-replicated services, idle resources running below 10% utilization for over 48 hours, and mis-sized instances. They also swiftly mitigated the security threat.
This case highlights how infrastructure optimization and risk management can amplify ROI. Avoiding downtime alone can save businesses thousands of dollars per minute in potential revenue losses. These savings, combined with the elimination of waste, directly impact the bottom line, showcasing the real-world benefits of a well-optimized infrastructure.
Pay-for-Performance Model
TechVZero operates on a pay-for-performance model, taking 25% of the annual savings they generate. If the savings fall below a pre-agreed threshold, clients pay nothing. This model removes the upfront financial risk typically associated with DevOps optimization, which can delay ROI by 6 to 12 months in traditional setups.
The focus here is on delivering measurable business outcomes – lower costs, less downtime, and faster feature rollouts – rather than just technical improvements. Clients only pay after realizing actual gains, ensuring that the "cost" in the ROI equation never surpasses the "gain." For founders who want results without diving into the complexities of infrastructure management, this approach offers a risk-free path to DevOps optimization.
Conclusion
Understanding and measuring DevOps ROI for AI workloads is crucial for achieving both sustainable growth and operational efficiency. Eva Dong, AI Value Realization Lead at Google Cloud Consulting, emphasizes this point perfectly:
"Generative AI is no longer just an experiment. The real challenge now is quantifying its value. For leaders, the path is clear: make AI projects drive business growth, not just incur costs".
To get started, focus on core DORA metrics while incorporating AI-specific KPIs like GPU/TPU utilization, cost per inference, and automation rates in MLOps pipelines. Elite teams aim for a change failure rate of 15% or lower and resolve incidents in under one hour. High-performing groups also treat cost as a technical requirement, tracking unit economics such as cost per customer or cost per feature.
By combining traditional DevOps metrics with AI-focused KPIs, organizations can ensure that technical advancements translate into tangible business results. For example, tracking GPU hours only matters if it leads to quicker, revenue-driving feature releases. Aligning metrics with business outcomes is the foundation for realizing effective DevOps ROI.
At TechVZero, we’ve seen these principles in action. Operating at a 99,000+ node scale, we’ve helped clients achieve measurable results – like saving $333,000 in a single month while thwarting a DDoS attack. Our pay-for-performance model, where we take 25% of annual savings and charge nothing if targets aren’t met, ensures that ROI is as transparent as it is impactful. For founders prioritizing strategic growth over technical complexities, this approach delivers results you can genuinely measure.
FAQs
What are the best ways for AI companies to measure DevOps ROI?
AI companies can evaluate DevOps ROI by focusing on metrics that directly tie operational performance to business results. A great starting point is the DORA metrics, which include deployment frequency, lead time for changes, change failure rate, and mean time to restore (MTTR). These indicators provide insight into how efficiently and reliably your systems operate, often leading to faster delivery times and reduced downtime costs.
For AI-specific workflows, it’s worth tracking additional metrics like deployment velocity, code quality improvements, and business impact KPIs (such as revenue generated per model release). To make the analysis meaningful, compare these metrics before and after adopting AI tools. Then, translate technical improvements into financial outcomes – consider factors like cost savings from fewer system failures, increased revenue from quicker feature rollouts, and productivity boosts from streamlined automation.
To maintain progress, establish baseline metrics, set achievable goals, and automate monitoring systems to catch and address any deviations quickly. This structured approach allows AI companies to measure DevOps ROI in clear financial terms, helping them make smarter investment decisions.
What key metrics should AI companies track to maximize DevOps ROI?
To get the most out of DevOps investments in AI-driven organizations, it’s important to keep an eye on both core DevOps metrics and AI-specific performance indicators. Let’s start with the basics: DORA metrics – deployment frequency, lead time for changes, change failure rate, and mean time to recovery (MTTR). These metrics are key for assessing how quickly and reliably your deployments, including model-training pipelines, are running.
On the AI side, metrics like model accuracy, data drift detection rates, training time per epoch, and inference latency or cost per prediction are crucial. These help ensure that your models stay effective and efficient over time. Operational metrics such as GPU/CPU utilization, pipeline throughput, and test coverage (for both code and models) are also essential for scaling your systems without driving up costs unnecessarily.
Lastly, business impact KPIs – like cost savings, revenue generated from new features, and team productivity – connect the technical side of things to actual financial results.
By keeping tabs on these metrics, AI-focused companies can consistently deliver reliable, high-performing models while staying cost-efficient and driving measurable business outcomes.
How does automating MLOps improve efficiency and reduce costs for AI companies?
Automation takes the hassle out of MLOps by turning tedious, manual tasks into smooth, repeatable workflows. With continuous integration (CI), continuous delivery (CD), and continuous training (CT) built into automated pipelines, teams can skip repetitive chores like rebuilding environments, retraining models, and redeploying services. The result? Fewer engineering hours, fewer mistakes, and quicker rollouts of model updates – all while making better use of resources.
These automated pipelines also adjust to workload demands on the fly, helping avoid unnecessary costs like idle GPU time or over-provisioned computing power. But it’s not just about saving money. Automation lets engineers shift their focus from routine maintenance to driving innovation, boosting both productivity and the pace of progress. Many AI companies that embrace MLOps automation have slashed expenses – sometimes by tens or even hundreds of thousands of dollars each month – while improving how often and reliably they can release new models. TechVZero is a trusted partner for AI teams looking to implement these strategies and get the most out of their investments.