Instrumenting Cost Metrics: What Devs Should Measure

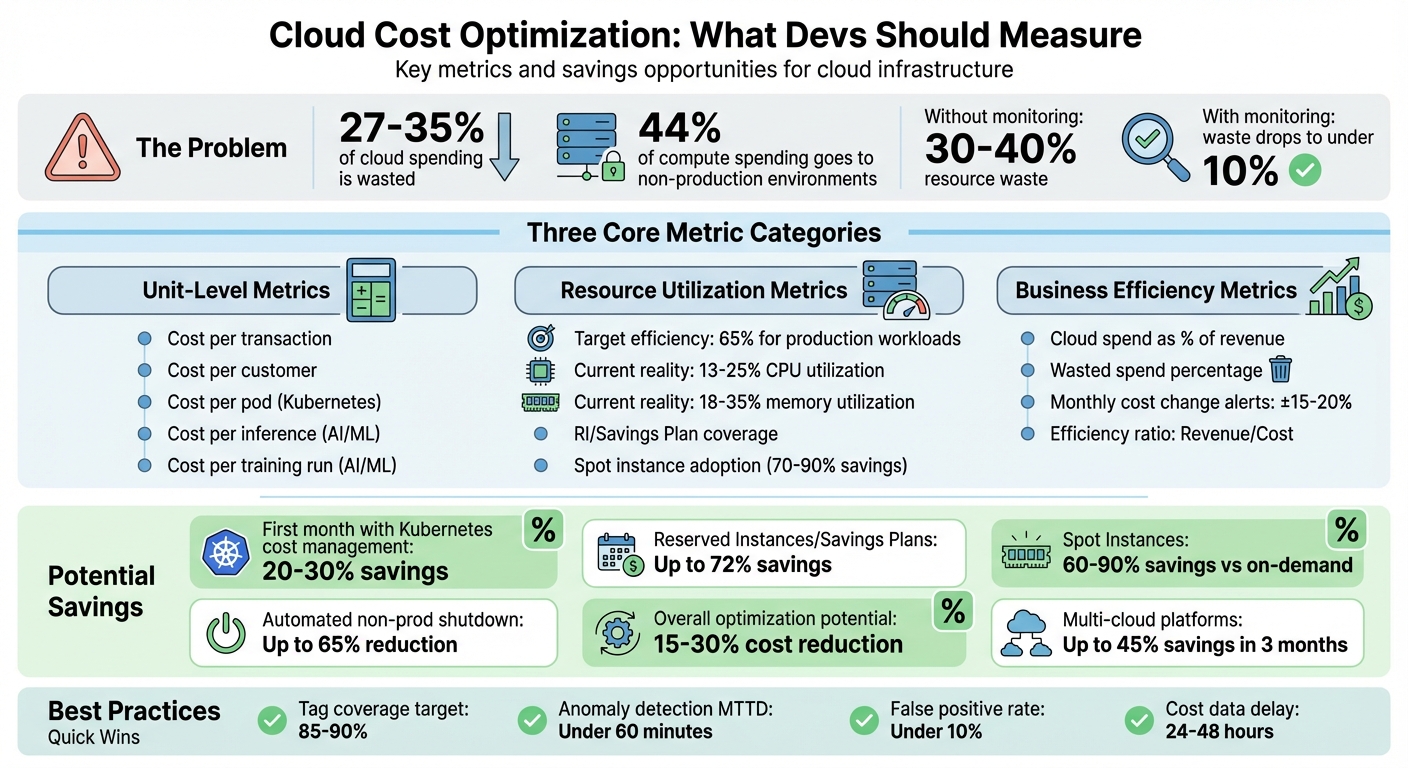
Cloud costs can quickly spiral out of control. On average, 27–35% of cloud spending is wasted on idle resources, overprovisioned instances, or forgotten services. Non-production environments alone can consume 44% of compute spending, much of which is unnecessary. The solution? Tracking cost metrics that highlight inefficiencies and tie spending to business outcomes.
Key takeaways:
- Unit-level metrics like cost per transaction or per customer provide actionable insights.
- Resource utilization metrics help optimize workloads, with healthy production workloads hitting about 65% efficiency.
- Business efficiency metrics connect spending to revenue, ensuring growth aligns with costs.
Tools like Kubecost and OptScale can integrate cost tracking into DevOps workflows, offering real-time visibility and actionable recommendations. By embedding cost metrics into CI/CD pipelines and setting up alerts for anomalies, teams can save 15–30% on cloud expenses while improving decision-making.
Want to cut your cloud bill? Start by tracking, tagging, and automating cost management in your workflows.
Cloud Cost Optimization: Key Metrics and Savings Opportunities
Cloud cost chaos? Get clarity with FinOps cloud cost management – Maria Valero Campaña
sbb-itb-f9e5962
Core Cost Metrics to Track
Keeping cloud spending in check starts with tracking the right metrics. By focusing on unit economics, resource utilization, and business efficiency, developers can streamline workflows and cut down on unnecessary expenses.
Unit-Level Metrics
Unit-level metrics help answer: "What does each business action cost us?" Instead of just looking at a lump-sum monthly bill, these metrics break down cloud expenses into smaller, actionable pieces. For example:
- Cost per transaction: Divide the total infrastructure cost by the number of transactions.
- Cost per customer: Measure what it costs to serve each active user.
For Kubernetes environments, a key metric is cost per pod. This is calculated as:
(max[reserved, actual] CPU/memory usage ÷ total node capacity) × node hourly cost.
This matters because nodes carry the same cost whether fully utilized or not.
"The node costs the same regardless of utilization. But to understand cost drivers, you must split the node cost proportionally." – Lyne Carolyne, CloudZero
For AI and machine learning workloads, other metrics come into play:
- Cost per inference: Tracks the marginal cost of serving predictions.
- Cost per training run: Measures the expense of running model experiments.
Once you have these granular insights, the next step is to evaluate how well resources are being used.
Resource Utilization Metrics
Resource efficiency is calculated as:
(actual usage ÷ requested resources) × 100.
A healthy production workload typically hits around 65% efficiency, allowing room for traffic surges while keeping waste in check.
Other critical metrics include:
- RI and Savings Plan coverage: Divide amortized commitment spend by the equivalent on-demand cost.
- Spot instance adoption rate: Measure the percentage of fault-tolerant workloads running on discounted instances. Spot instances can save 70–90% compared to on-demand pricing.
Resource overestimation can lead to wasted capacity. For instance, aligning resource requests with actual usage can triple the number of pods a single node can host compared to an overprovisioned setup.
Business Efficiency Metrics
While technical metrics provide detailed cost insights, business efficiency metrics connect spending to overall performance.
One important metric is cloud spend as a percentage of revenue, which normalizes infrastructure costs against business growth. If revenue doubles but cloud costs grow disproportionately, it could indicate inefficiencies in scaling.
Other metrics to watch include:
- Wasted spend: Calculate idle capacity expense as a percentage of total monthly spend.
- Monthly cost changes: Set alerts for deviations of ±15–20%.
Without active cost monitoring, organizations often waste 30–40% of resources. By keeping a close eye on spending, waste can drop to under 10%.
Adding Cost Metrics to DevOps Workflows
Cloud cost data is often separated from key infrastructure decision points like CI/CD pipelines, Terraform modules, pull requests, and Helm charts. By embedding cost metrics directly into DevOps workflows, teams can make financially informed decisions early on, preventing expensive missteps in production. Here’s how to weave cost insights into your DevOps processes for better cost management.
Creating Cost Visibility
To achieve cost visibility, resource tagging and detailed billing exports are essential. Start by enabling detailed billing exports from your cloud provider:
- AWS: Set up Cost and Usage Reports (CUR) to export data to Amazon S3. Use hourly granularity and Apache Parquet compression for faster analysis.
- GCP: Configure billing exports to BigQuery, enabling SQL-based analysis.
- Azure: Use Azure Cost Management to generate detailed cost exports.
For efficient analysis, connect these billing exports to serverless query engines. For instance, AWS users can leverage Amazon Athena, while GCP users can rely on BigQuery. This eliminates the need for additional infrastructure. Keep in mind, cost data may take 24–48 hours to become available.
In Kubernetes environments, tools like Kubecost can provide granular cost breakdowns by namespace, deployment, or custom labels. These tools expose costs as Prometheus metrics, making them accessible alongside performance data. Organizations implementing Kubernetes cost management often see savings of 20–30% within the first month.
Attributing Costs Through Resource Tagging
Tagging resources at the Infrastructure as Code (IaC) level is key to accurate cost attribution. Establish a standardized tagging system across your organization, covering:
- Business Ownership: Tags like team, cost-center, and project.
- Technical Properties: Tags for environment, app, and version.
- Automation: Tags for backup plans or start-stop schedules.
To enforce tagging, use policy controls. AWS Service Control Policies (SCPs), Azure Policy, or GCP Organization Policies can block the creation of resources that lack required tags. In Kubernetes, admission controllers like Kyverno or Gatekeeper can reject workloads missing necessary cost-tracking labels.
Terraform users can simplify tagging by defining common labels as local variables in modules. This ensures resources automatically inherit appropriate ownership and environment tags. In GCP, remember that labels are used for cost tracking, while tags are specific to IAM policy bindings. An 85–90% tag coverage rate strikes a balance between operational feasibility and financial accuracy.
Connecting Cost Data with Observability Platforms
Integrating cost metrics with observability platforms like Grafana and Looker helps correlate expenses with performance data. For example:
- Grafana: Configure the Athena plugin with your region, database, and workgroup details for AWS.
- Looker Studio: Use the BigQuery connector with a service account that has bigquery.dataViewer and iam.serviceAccountTokenCreator permissions for GCP.
Optimize dashboards by using Prometheus recording rules to precompute complex cost-efficiency queries, such as "estimated hourly cost per namespace." This ensures quick load times, even when analyzing 90 days of historical data. Linking costs to utilization metrics transforms waste into actionable insights.
"Cost visibility changes behavior. When teams can see what they are spending, they naturally start making smarter decisions about resource requests." – Nawaz Dhandala, OneUptime
To automate cost tracking, use Kyverno mutation rules to propagate labels from deployments to pods. This eliminates unattributed costs in observability platforms, helping teams quickly identify inefficiencies and optimize spending. By integrating these practices, DevOps teams can align their workflows with cost-conscious decision-making.
Monitoring Costs and Detecting Anomalies
Keeping costs in check goes beyond setting budgets – it’s about active, ongoing monitoring. Studies show that without proper oversight, up to 40% of cloud resources can go to waste. To avoid this, you need systems that flag both budget thresholds and unusual spending patterns in real time.
Configuring Alerts and Thresholds
Cost metrics are only useful if they’re paired with proactive monitoring. Budget alerts notify you when spending reaches a predefined percentage of your limit – like 80% of a $5,000 monthly budget. Meanwhile, anomaly alerts rely on machine learning to spot irregularities, such as a sudden daily cost jump from $150 to $300 caused by deploying 20 premium-tier VMs by mistake.
To catch problems early, set multi-stage thresholds at intervals like 25%, 50%, 75%, and beyond [35,38]. Forecasted alerts can even warn you of potential overspending before you hit your actual limits [35,15]. For example:
- In AWS, use
aws_ce_anomaly_monitorto track spending by service or tags, and pair it withaws_ce_anomaly_subscriptionto send alerts when costs exceed a set amount (e.g., $100) [34,37]. - On GCP, integrate budgets with Pub/Sub to trigger automated actions, such as scaling down non-essential resources.
- In Kubernetes, Prometheus can calculate 7-day rolling averages and alert you when costs exceed 1.5 times the baseline.
Instead of routing alerts to individual inboxes, send them to shared Slack or Teams channels so the entire team stays informed [36,10]. Azure’s anomaly detection tool is free for production subscriptions, though it processes data with a 1–2 day delay.
Identifying Billing Anomalies
When an alert fires, the first step is to pinpoint the cause. Break down spending by service, region, usage type, or resource tags to uncover the source [40,41]. Granular RCA (root cause analysis) tools let you drill down from broad categories to specific resource meters or SKUs [39,36]. Anomalies can significantly impact your bill – sometimes accounting for up to 200% of monthly costs – so responding quickly is critical.
To speed up detection, correlate spending spikes with logs like Azure’s Activity Logs or AWS’s CloudWatch Dashboards to see if recent deployments or configuration changes are to blame [34,36]. Use dual thresholds – one based on dollar amounts (e.g., over $100) and the other on percentage changes (e.g., a 20% deviation) – to catch both small but frequent issues and major cost jumps [39,41]. Suppression windows during high-spend periods, such as migrations, can help filter out false positives.
Mature FinOps setups aim for a false-positive rate under 10% and a Mean Time to Detect (MTTD) under 60 minutes.
"Cloud spending anomalies are silent budget killers. They don’t trigger outages. They don’t page anyone. They just accumulate until someone opens the invoice." – Nawaz Dhandala, OneUptime
To improve anomaly detection over time, mark known spikes (like planned migrations) as expected, helping the system refine its accuracy [39,41]. By routing alerts effectively and automating responses, teams can reduce acknowledgment and resolution times for cost incidents by around 30%.
With these strategies, you can identify and address inefficiencies quickly, paving the way for better cost management.
Tools for Tracking Cost Metrics
Once you’ve set up monitoring and alerts, the next step is selecting tools that can transform spending data into meaningful insights. These tools help developers seamlessly integrate cost awareness into their DevOps workflows, aligning with the goal of reducing cloud expenditures through actionable metrics.
Kubernetes Cost Monitoring
For teams managing containerized workloads, Kubecost and OpenCost are standout tools for real-time cost allocation. They provide detailed visibility into expenses across services, deployments, namespaces, labels, pods, and containers. OpenCost, initially developed by Kubecost, is a vendor-neutral project under CNCF and is available for free under the Apache 2.0 license. Kubecost, on the other hand, offers a free Foundations tier for clusters with up to 250 cores and 15-day metric retention, while its Enterprise tier supports unlimited clusters, extended retention, and multi-cluster views.
Both tools can integrate with cloud provider APIs (AWS, GCP, Azure) to align in-cluster usage with actual billing data, accounting for factors like discounts and spot pricing. Additionally, the kubectl-cost CLI plugin allows you to query cost and efficiency metrics directly from the terminal. It even enables you to predict the financial impact of changes before deploying them using the command kubectl cost predict -f <file>.yaml. Many organizations report significant savings – often 30–50% or more – on total infrastructure costs by leveraging these insights.
For teams operating beyond Kubernetes, multi-cloud management platforms provide a broader perspective.
Multi-Cloud Management Platforms
Managing resources across multiple cloud providers? Platforms like OptScale offer a consolidated view of AWS, Azure, GCP, Alibaba Cloud, and Kubernetes environments. These tools help map consumption to specific teams, projects, or business units while offering automated recommendations for optimization. Examples include rightsizing virtual machines, identifying unused storage volumes or snapshots, and eliminating duplicate objects in S3 buckets. Mid-size and enterprise teams often see savings of up to 45% within just three months.
OptScale is available as an open-source solution (Apache 2.0) on GitHub or as a SaaS platform. Its features include TTL (Time-to-Live) rules, budget quotas, and "notify & destroy" scenarios to curb overspending. It also supports environment management for scheduling and sharing test infrastructure. By planning for commitment-based pricing options like Reserved Instances and Savings Plans, these platforms can help achieve up to 72% savings compared to on-demand pricing.
Real-Time Monitoring Integrations
To enhance visibility, real-time integrations can merge cost data into your existing observability stack. Tools like Prometheus, Grafana, and native services such as AWS CloudWatch work seamlessly with cost tracking solutions. For instance, Kubecost provides Prometheus metrics like kubecost_cluster_cost_total and kubecost_namespace_cost_total, along with granular hourly CPU and memory costs at the pod level. These metrics can be visualized in real-time, with automated alerts sent via Slack or PagerDuty to flag budget thresholds or anomalies caused by misconfigurations.
For teams leveraging GitOps workflows, integrating cost monitoring tools like Kubecost into ArgoCD creates a feedback loop. In this setup, ArgoCD manages resource deployment, while Kubecost evaluates the cost implications. You can even automate right-sizing workflows, where Kubecost recommendations trigger Git branches or Pull Requests to adjust resource requests and limits. Exporting cost data into your existing observability tools ensures that cloud spending becomes visible and actionable – without adding yet another dashboard to monitor.
Measuring Cost Optimization Results
Once you’ve implemented cost tracking and anomaly detection, it’s time to measure how well your optimization efforts are paying off. This means tracking metrics like unit economics over time. Even if total costs rise, they should align with your growth to make sense.
Setting Baseline Metrics
Start by establishing a 30-day baseline window. This helps you capture patterns like monthly peaks, batch jobs, or seasonal trends, and link your infrastructure spending to business metrics. For instance, you might track cost per active customer, cost per API call, or cost per order processed.
Here’s an example: an e-commerce company might calculate its baseline as "Monthly infrastructure cost / Orders processed." Meanwhile, a SaaS API provider could use "Compute cost / Total API calls".
Don’t overlook idle resources like unattached volumes, orphaned snapshots, or idle load balancers. Including these in your baseline can highlight waste quickly. Also, calculate utilization ratios (actual usage versus provisioned resources) to spot over-provisioning. When right-sizing, consider adding a headroom multiplier (usually 1.3x) to handle unexpected traffic spikes. Many organizations report savings of 20–30% within the first month of applying these practices.
Once your baseline is in place, keep monitoring these metrics to track the impact of your optimizations.
Monitoring Efficiency Over Time
Use rolling averages – like 7-day or 14-day windows – to track your cost-per-unit metric. This smooths out daily fluctuations and captures peak demand patterns. For example, if your cost per 1,000 API requests is dropping while traffic is increasing, you’re on the right track.
Mark your dashboards with optimization milestones, such as "Implemented Spot Instances" or "Right-sized API cluster", to clearly connect actions with outcomes. To make long-term trend analysis easier, use tools like Prometheus recording rules to precompute complex queries. For production environments, aim for a workload efficiency of about 65%, which balances cost and performance.
Another key metric is the efficiency ratio (Revenue / Cost). This helps you see if your infrastructure spending is driving more business value over time.
Evaluating Pricing Models
To ensure your optimizations translate into real savings, evaluate your pricing models using cost-per-unit metrics. Start with on-demand pricing as your baseline – ideal for workloads that are unpredictable. For example, an AWS m5.large instance costs about $0.096 per hour.
For steady-state workloads, Reserved Instances and Savings Plans can cut costs by up to 72%. Spot Instances offer even deeper discounts – typically 60–90% compared to on-demand rates – but they require workloads that can handle sudden termination notices within two minutes.
Track your Effective Savings Rate (ESR) to measure the financial benefits of your commitments. This combines factors like commitment coverage, utilization, and actual discount rates. Aim for 70–90% coverage on steady-state compute, with 95–100% utilization of purchased discounts across your portfolio. By comparing the portion of your bill at full on-demand pricing to discounted rates, you can pinpoint missed savings opportunities. Teams that formalize these KPIs often achieve 15–30% cost reductions as they refine their optimization strategies.
Conclusion
Managing cloud costs effectively requires action and attention to detail. One of the biggest culprits of waste lies in the gap between what you provision and what you actually use. A good starting point? Follow Kubernetes best practices by labeling everything consistently from day one. Use tags like team, env, and cost-center to ensure every dollar is accounted for and has an owner.
The numbers speak for themselves. On average, Kubernetes clusters operate at just 13–25% CPU and 18–35% memory utilization. Overprovisioning is a common issue, especially with critical workloads. However, teams that establish formal cost KPIs often see reductions of 15–30% as they refine their processes.
Make cost optimization part of your routine. For example, automating the shutdown of non-production environments can slash development and testing costs by up to 65%. Additionally, setting up anomaly alerts for spending deviations of ±15–20% from your baseline can help catch misconfigurations before they inflate your monthly bill.
"When teams own both performance and cost outcomes, optimizations happen faster and last longer."
– Joe Dahlquist, Apptio
FAQs
Which 3 cost metrics should I start with first?
To get started with managing cloud expenses, focus on three key cost metrics: total cloud spend, resource utilization rate, and cost per workload. These metrics provide a solid starting point for understanding and controlling cloud costs. By monitoring them, you can pinpoint inefficiencies, make smarter resource allocation decisions, and gain clearer insights into your overall cloud spending habits.
How do I map cloud spend to a team or service reliably?
To effectively track cloud spending and assign costs to the right teams or services, it’s essential to implement a cost allocation strategy. Start by using resource labels or tags such as owner, team, service, env, and cost-center. These tags help categorize expenses and make it easier to understand who or what is driving costs.
To ensure resources are always labeled, you can use tools like validating webhooks to block the creation of unlabeled resources. For Kubernetes environments, you can set up cost labels directly on clusters or leverage tools like Kubecost for detailed cost tracking.
Make it a habit to regularly review budgets, quotas, and reports. This practice not only ensures that costs are accurately attributed but also helps identify and reduce unnecessary spending.
What alert thresholds catch cost spikes without noise?
Effective alert thresholds are key to spotting cost spikes while avoiding constant, distracting notifications. To achieve this, consider factors like baseline seasonality, deployment schedules, and namespace-specific activities. Automated tools, such as anomaly detection systems, can be incredibly helpful in flagging unexpected spending patterns early, giving you a chance to address issues before they lead to budget overruns. It’s also important to fine-tune these thresholds to fit your specific environment, ensuring they remain both sensitive and meaningful.