Checklist for Cost-Effective Kubernetes Scaling

Kubernetes can waste up to 50% of your cloud budget. Overspending is common because resources are often over-provisioned and underutilized, especially for CPU and GPU-heavy workloads. Here’s how you can cut costs without sacrificing performance:
- Set Accurate Resource Requests and Limits: Use tools like Prometheus to monitor usage and adjust CPU/memory settings based on actual needs. Aim for 60–80% utilization.
- Use Autoscaling Tools: Combine Horizontal Pod Autoscaler (HPA) for real-time scaling and KEDA for event-driven workloads. Cluster-level tools like Karpenter can reduce idle node costs by up to 44%.
- Leverage Spot Instances: Save 60–90% by running stateless or fault-tolerant workloads on spot instances. Use Pod Disruption Budgets to handle interruptions.
- Optimize Storage and Networking: Audit persistent volumes and load balancers to eliminate unused resources. Consolidate services with an Ingress Controller to reduce costs.
- Scale Non-Production to Zero: Automate shutdowns for dev/test environments during off-hours using tools like KubeGreen.
- Monitor Costs with Labels: Use Kubernetes labels to track spending by team or application and automate chargeback reports.
Efficient scaling can save startups tens or hundreds of thousands annually. Start by analyzing your cluster’s utilization and implementing these cost-saving strategies.
Kubernetes Cost Optimization: Resource Efficiency Master Guide
sbb-itb-f9e5962
Set Accurate Pod Requests and Limits
Getting pod requests and limits right is the first step to cutting down on Kubernetes overspending.
Many Kubernetes clusters waste resources because engineers often rely on guesswork when setting CPU and memory requests. For instance, a pod might request 500m CPU but only use 50m, leaving 90% of the allocation idle.
Requests define the minimum CPU and memory Kubernetes guarantees for scheduling, while limits set the maximum a pod can consume. This distinction is crucial: CPU is compressible, so throttling just slows down your app, but memory isn’t. If a container exceeds its memory limit, Kubernetes kills it with an OOMKill.
Measure Actual Resource Utilization
The first step is to monitor what your pods are actually using. A quick way is to run kubectl top pods, which shows current CPU (in cores) and memory (in bytes) usage across namespaces. For deeper insights over a 7–14 day period, tools like Prometheus and Grafana are invaluable.
Pay attention to two key metrics: container_cpu_usage_seconds_total for CPU and container_memory_working_set_bytes for memory. The latter gives a better picture of active memory usage. Ideally, containers should be running at 60–80% of their requested resources in a healthy cluster.
When setting requests, aim for the 95th percentile of typical CPU usage to handle bursts and the 99th percentile for memory, adding a 10–20% buffer. For limits, set CPU limits 2–5x higher than requests (or skip them for latency-sensitive apps) and memory limits at around 110–150% of requests.
Use Vertical Pod Autoscaler (VPA) in Recommendation Mode
Leverage the Vertical Pod Autoscaler (VPA) in recommendation mode (updateMode: "Off") to get resource sizing suggestions based on historical data without risking pod restarts. This approach is particularly helpful for stateful or production workloads where downtime isn’t an option.
The VPA uses a 14-day window to analyze consumption trends, peak usage, and OOM events, generating three values: Target (optimal for typical usage), Lower Bound (minimum viable), and Upper Bound (maximum reasonable). Use the Target value as a baseline for container resource requests, and set minAllowed and maxAllowed limits in the VPA resource policy to avoid recommendations that are either too small to function or too costly.
"The Vertical Pod Autoscaler can adjust the requests and limits assigned to containers so workloads run optimally. You should run the VPA in auditing mode so it does not automatically make changes and restart your pods." – Amazon EKS Best Practices
To make the most of VPA recommendations, tools like Goldilocks can help visualize them across namespaces, while Kubecost highlights the gap between requested and used resources. Fine-tuning these settings lays the groundwork for more efficient autoscaling.
Use Autoscaling Tools for Efficiency
Karpenter vs Cluster Autoscaler: Feature Comparison for Kubernetes Cost Optimization
Let Kubernetes handle resource adjustments automatically, reducing the hassle of manual provisioning and cutting costs tied to idle resources or peak load preparation.
Configure Horizontal Pod Autoscaler (HPA)
The Horizontal Pod Autoscaler (HPA) is a tool that dynamically adjusts the number of pod replicas based on real-time metrics like CPU and memory usage [30,33]. To use HPA effectively, you must define resources.requests in your pod specifications. Without these values, the autoscaler can’t calculate utilization accurately [30,32]. Using the autoscaling/v2 API is recommended, as it supports a broader range of metrics, including custom and external ones [30,31].
When multiple metrics are configured, HPA evaluates each independently and scales based on the highest replica count needed. To avoid constant scaling up and down, set a stabilization window (e.g., stabilizationWindowSeconds=300) to smooth out fluctuations [30,35]. You can also limit scaling changes with policies like capping scale-down adjustments to 10% of replicas per minute. For applications with longer startup times, such as Java-based apps, adjust the --horizontal-pod-autoscaler-cpu-initialization-period to account for the warm-up period and prevent unnecessary scaling.
Deploy KEDA for Event-Driven Scaling
KEDA (Kubernetes Event-Driven Autoscaling) extends HPA by allowing scaling based on external event sources like message queues, databases, or HTTP traffic. One standout feature of KEDA is its ability to scale workloads down to zero during inactivity, eliminating costs tied to idle pods [36,41]. With over 70 built-in scalers for various platforms, KEDA is highly versatile [36,38].
"Scaling to zero ensures that no Pods are instantiated when no messages have been received for a while. This saves resources as no Pods stay idle for long periods of time." – Google Cloud Documentation
For HTTP-based workloads, use the KEDA HTTP add-on and configure settings like scaledownPeriod and targetValue to manage request buffering and avoid failures. Additionally, setting a stabilizationWindowSeconds (e.g., 300 seconds) in the horizontalPodAutoscalerConfig helps prevent abrupt scaling changes. To maintain security, use IAM roles (like AWS IRSA or GCP Workload Identity) to grant KEDA minimal permissions for accessing external metrics [37,39,41].
While HPA and KEDA focus on pod-level scaling, cluster-level autoscalers manage the underlying node infrastructure, ensuring resources align with overall demand.
Implement Cluster Autoscaler or Karpenter
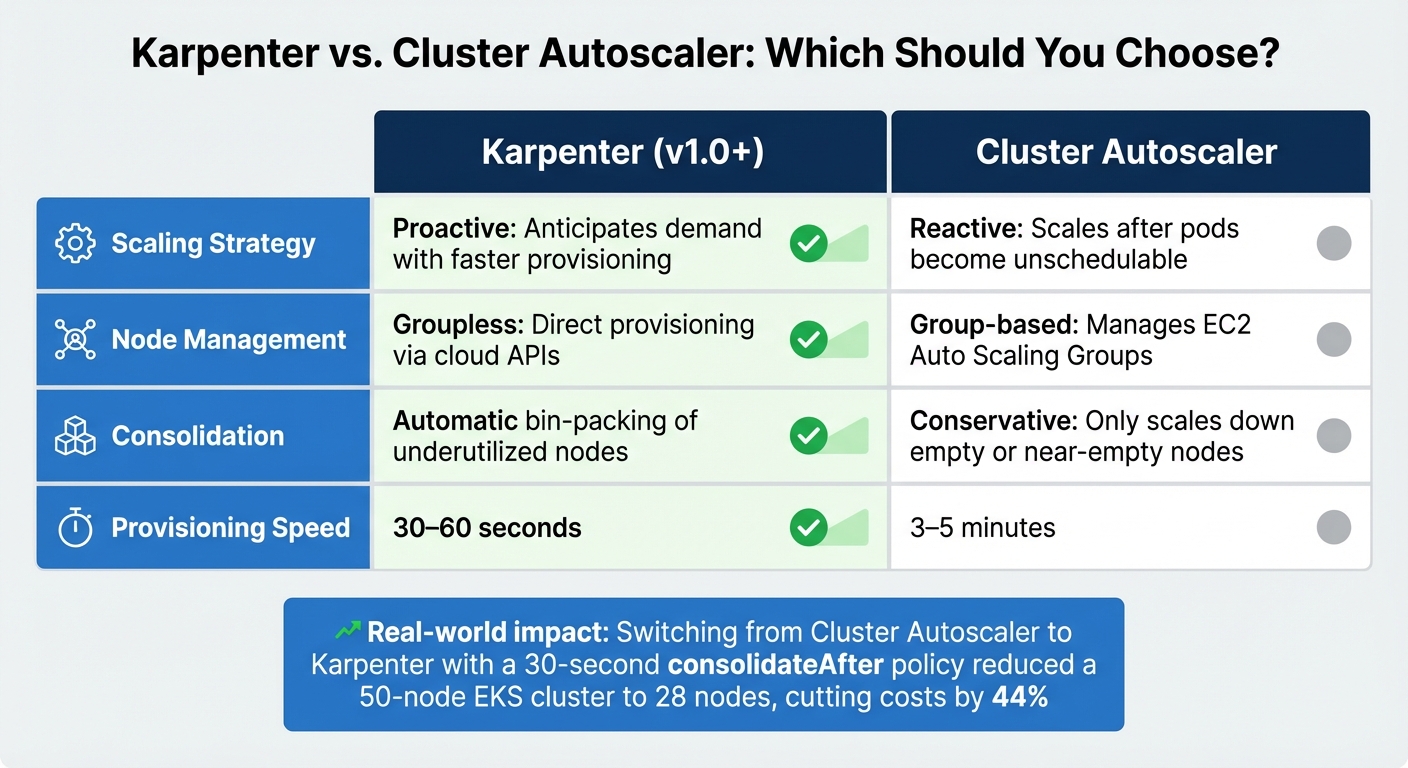
Cluster-level autoscalers like Cluster Autoscaler and Karpenter ensure that the infrastructure adapts to workload demands. Karpenter, in particular, is known for its speed, provisioning nodes in just 30–60 seconds compared to the 3–5 minutes typical of Cluster Autoscaler. It interacts directly with cloud APIs and uses proactive consolidation to pack pods onto fewer nodes, reducing underutilized capacity [6,45,27].
In one example, switching from Cluster Autoscaler to Karpenter with a 30-second consolidateAfter policy cut a 50-node EKS cluster down to 28 nodes, slashing costs by 44%.
| Feature | Karpenter (v1.0+) | Cluster Autoscaler |
|---|---|---|
| Scaling Strategy | Proactive: Anticipates demand with faster provisioning | Reactive: Scales after pods become unschedulable |
| Node Management | Groupless: Direct provisioning via cloud APIs | Group-based: Manages EC2 Auto Scaling Groups |
| Consolidation | Automatic bin-packing of underutilized nodes | Conservative: Only scales down empty or near-empty nodes |
| Provisioning Speed | 30–60 seconds | 3–5 minutes |
For maximum efficiency, avoid limiting NodePools to a single instance type. Instead, use flexible instance requirements (e.g., m7i.*, c7i.*), allowing the autoscaler to choose the most cost-effective options [6,46]. Supporting both ARM (Graviton) and x86 architectures can further reduce costs, as Graviton instances often deliver 15–30% better price-performance [6,27]. For Spot instances, choose multiple instance families to minimize interruptions and take advantage of discounts ranging from 60–90% compared to On-Demand pricing [6,44].
Finally, use Pod Disruption Budgets (PDBs) to ensure high availability during node consolidation. For critical workloads, apply annotations like cluster-autoscaler.kubernetes.io/safe-to-evict=false or karpenter.sh/do-not-evict: "true" to prevent disruption to expensive or sensitive processes [6,27,46].
Optimize Node Pools and Instance Types
Fine-tuning node pools builds upon effective autoscaling strategies to further manage costs.
Choosing the right node pools and instance types can significantly reduce your monthly cloud expenses.
Categorize your workloads into two groups: "Spot-Safe" (e.g., stateless APIs, batch jobs, CI/CD runners) and "Avoid Spot" (e.g., databases, stateful applications, real-time processing). Set up dedicated node pools for each group – use on-demand instances for critical workloads and spot instances for less sensitive tasks. This balanced approach allows you to run fault-tolerant applications at discounts of 60–90%, while ensuring essential services remain stable on guaranteed infrastructure.
Diversify instance types within each node pool to reduce risks. For example, configure flexible options like m7i.*, m6i.*, and c7i.*. This strategy minimizes the impact of instance shortages and gives your autoscaler more cost-effective choices. Mixed architectures can also improve cost efficiency.
These tactics combine scalable performance with reduced spending.
Create Node Pools for On-Demand and Spot Instances
Set up separate node pools based on workload reliability requirements. Use an on-demand pool for critical tasks like databases, ingress controllers, and singleton services that cannot tolerate interruptions. For stateless workloads, batch jobs, and development, rely on a spot pool.
For example, a batch processing workload previously running entirely on on-demand instances at $12,000 per month was shifted to an 80% spot and 20% on-demand mix. By implementing Pod Disruption Budgets and using Karpenter for automatic reprovisioning, costs dropped to $3,200 per month – a 73% reduction – while maintaining a 99.8% job completion rate, even with 2–3 interruptions per week.
Set Up Spot Instances with Scheduling Rules
To keep critical workloads safe, taint spot node pools (e.g., spot-instance=true:NoSchedule) and apply matching tolerations only to deployments that can handle interruptions. Additionally, use node affinity with a preferredDuringSchedulingIgnoredDuringExecution policy. This ensures pods prioritize spot nodes but can fallback to on-demand nodes if needed.
Deploy a termination handler, such as the AWS Node Termination Handler, to gracefully drain pods when a spot interruption notice is issued. AWS typically provides a 2-minute warning, while GCP and Azure offer 30 seconds. Pair this with Pod Disruption Budgets that set appropriate minAvailable values to maintain a minimum number of replicas during transitions.
"The key to using spots successfully is treating them as ephemeral. Assume any spot instance can disappear at any moment." – Nawaz Dhandala, Author, OneUptime
Comparison Table: On-Demand vs. Spot Instances
| Feature | On-Demand Instances | Spot Instances |
|---|---|---|
| Cost | Full Price (100%) | 10–40% of on-demand price |
| Reliability | Guaranteed availability | Interruptible with 30s–2m notice |
| Best Use Case | Databases, critical APIs, singletons | Stateless apps, batch jobs, dev/test |
| Interruption Rate | None | 2–5% per week |
| Scaling | Predictable | Subject to market capacity |
Spot interruption rates generally range from 2–5% weekly, depending on the region and instance type. By spreading workloads across various instance types and setting up thoughtful scheduling rules, you can achieve major cost savings without compromising reliability.
Right-Size Storage and Networking Costs
Once you’ve optimized your node pools, it’s time to tackle storage and networking costs – two areas where hidden expenses can quietly drain your Kubernetes budget. Persistent volumes that aren’t attached and unused load balancers can make up a hefty 30–50% of your total Kubernetes spending. For context, an abandoned load balancer might cost you $20–$50 per month, while an unbound 100GB persistent volume could add about $10 monthly. Multiply these costs across multiple namespaces and environments, and the numbers quickly escalate. Addressing these "ghost spends" is a natural next step after refining your resource allocations.
Audit Persistent Volumes for IOPS Needs
Persistent volumes (PVs) are often over-provisioned, leading to unnecessary costs. Using Prometheus metrics like kubelet_volume_stats_used_bytes can help you compare actual usage against what you’ve provisioned. To pinpoint orphaned volumes that are still billing you after their claims have been deleted, run:
kubectl get pv --field-selector status.phase=Released Another key consideration is your persistentVolumeReclaimPolicy. Volumes with a Retain policy stick around even after deletion, continuing to rack up charges. Check your storage classes too – high-performance tiers might not always be necessary. Enabling allowVolumeExpansion: true lets you start with a smaller volume and scale it only when required.
For example, AWS gp3 volumes offer independent tuning of IOPS and throughput without needing to increase the volume size, unlike the older gp2 volumes that tie performance to capacity. Additionally, regional disks, while offering geographic redundancy, are generally twice as expensive as zonal disks. Make sure you actually need that extra redundancy before committing to it.
Reduce LoadBalancer Usage
Every Kubernetes service marked as type: LoadBalancer automatically provisions a cloud load balancer, which comes with a base hourly fee. Instead of creating separate load balancers for each service, you can consolidate traffic with a single Ingress Controller, such as NGINX or Istio. This approach allows multiple services to share one load balancer by routing traffic based on hostnames or paths.
To identify unused load balancers, run:
kubectl get svc -A | grep LoadBalancer Then, cross-check these results with your cloud provider’s console to find any orphaned resources. On AWS EKS, you can further cut costs by configuring the Load Balancer Controller to use ip mode instead of instance mode. This setup routes traffic directly to pods, reducing cross-availability zone data transfer fees, which typically run $0.01–$0.02 per GB.
"Persistent volumes (PVs) are one of the most common sources of ‘ghost spend’ in Kubernetes." – Joe Dahlquist, Kubecost
Scale Non-Production Environments to Zero
Non-production environments often run continuously, even though they’re typically active for just 40 hours a week. This results in up to 76% of resources being wasted. Automating shutdowns for these development and test environments can help cut costs by 60–70%. By applying the autoscaling strategies mentioned earlier, scaling non-production workloads to zero during off-hours becomes a practical way to save resources.
Automate Off-Hours Shutdowns with KubeGreen
KubeGreen is a Kubernetes operator designed to manage sleep and wake-up schedules for namespaces through a SleepInfo Custom Resource Definition (CRD). It works by scaling deployments down to 0 replicas and pausing CronJobs during off-hours. For example, in a real-world scenario involving a cluster with 75 namespaces (48 of which were enabled with KubeGreen), the tool reduced active pods from 1,050 to 450. This allowed the number of nodes to drop from 13 to 7 during off-hours.
To ensure critical workflows remain operational, you can configure the excludeRef field to keep essential components, like API gateways, running while other workloads are suspended. Don’t forget to set the timeZone parameter in your SleepInfo configuration, such as "America/New_York" or "America/Los_Angeles", to align shutdowns with your team’s working hours. For even greater savings, combine pod scaling with tools like Cluster Autoscaler or Karpenter to decommission unused nodes.
Additionally, ephemeral workloads, such as CI/CD runners, can be optimized to further cut down idle costs.
On-Demand Scaling for CI/CD Runners
CI/CD build agents are perfect candidates for spot instances since they are stateless and can recover from interruptions. For instance, in March 2024, Rippling managed to lower its EC2 compute costs by 60% by migrating its build agent fleet to AWS Spot Instances using the Buildkite Elastic CI Stack for AWS.
To eliminate costs during periods of inactivity, configure your autoscaler to scale CI/CD runners to zero when the job queue is empty. Use taints for spot node pools, like node-type=spot:NoSchedule, and apply matching tolerations to your CI/CD runner pod specifications to ensure they run exclusively on cost-efficient spot hardware. To improve the chances of finding available spot capacity, include multiple instance families, such as m5.xlarge, m5a.xlarge, and m4.xlarge, in your runner node group.
Finally, deploy node termination handlers to handle interruptions effectively. These handlers monitor signals from cloud providers – AWS offers a 2-minute warning, while GCP and Azure provide about 30 seconds – giving runners enough time to finish jobs or checkpoint progress before termination.
Monitor and Allocate Costs with Kubernetes Labels
Tracking costs in Kubernetes can feel like untangling a web of complexity. But Kubernetes labels – those handy key-value pairs on pods, namespaces, and nodes – offer a way to pinpoint which teams, projects, or cost centers are driving your spending. For SaaS and AI startups navigating the challenges of scaling Kubernetes, using these labels effectively can make a big difference. When done right, these labels integrate with your cloud provider’s billing system, turning vague infrastructure expenses into clear, actionable insights.
For example, in Amazon EKS, these labels transform into "user-defined cost allocation tags" that show up in AWS Cost and Usage Reports (CUR). This allows for pod-level cost attribution. Over on Google Kubernetes Engine (GKE), cluster and node pool labels feed into billing reports and BigQuery exports. By using consistent label keys across both Kubernetes pods and external resources like RDS instances or S3 buckets, you can calculate the Total Cost of Ownership for an entire application.
Consistency is key here. As Joe Dahlquist from Apptio points out, inconsistent labeling – like mixing CostCenter, cost-center, and costcenter – can fragment your reports. To avoid this, establish a "Label Contract", an organization-wide naming convention, and enforce it using tools like Kyverno or OPA Gatekeeper. These tools can reject deployments missing mandatory labels, ensuring your cost attribution system stays intact.
Tag Resources with Detailed Labels
Start by defining a baseline set of labels for every resource. Common examples include app, team, env, and cost-center. Amazon EKS allows up to 50 Kubernetes labels per pod for cost allocation, but only selects them alphabetically. So, prioritize naming your critical labels to ensure they show up early in the list. Keep in mind that AWS cost allocation tags have limits – 128 characters for keys and 256 for values. Anything longer will be ignored.
To maintain consistency, automate label application using tools like Terraform, Helm, or Kustomize. For better compatibility with third-party tools, use the standard Kubernetes prefix app.kubernetes.io/ for labels such as name, instance, component, and part-of. However, adding labels isn’t enough. You’ll need to manually activate them as cost allocation tags in your cloud provider’s console. Be patient – this activation process can take up to 24 hours to appear and another 24 hours to fully activate.
Consistent and detailed labeling lays the groundwork for streamlined billing and effective cost allocation.
Automate Billing Reports and Chargeback Policies
Once your labels are in place, automate reporting to allocate costs back to the teams responsible for them. Tools like Kubecost (OpenCost) make this easier with APIs like /model/allocation, which you can query on a schedule – say, the first of every month – to produce team-specific chargeback reports in CSV format. To keep teams accountable, configure budget alerts that notify them via Slack when spending for specific labels, such as team: ml-platform, exceeds predefined thresholds.
AWS users can take advantage of the Cloud Intelligence Dashboards (SCAD), which use Athena views to map Kubernetes labels to AWS resource tags, offering a clear view of Total Cost of Ownership. Enabling split cost allocation data in Amazon EKS doesn’t come with extra charges, though you’ll still pay standard S3 storage fees for the CUR files.
"Accurate allocation turns ‘why is the bill so high?’ into ‘here’s the team and service driving it.’" – Linda Cuanca, Head of Sales at ClusterCost
To keep everyone informed, send weekly cost reports to engineering teams and monthly CSVs to finance. Advanced chargeback models can even allocate costs for idle cluster resources or shared services like kube-system proportionally across all labeled teams, ensuring no expense goes unaccounted for.
TechVZero Bare Metal: Cut Costs Without Compromise
If you’re looking to reduce infrastructure costs, bare metal could be the game-changer you need. While autoscaling and resource adjustments can help, rethinking your setup with bare metal Kubernetes can slash expenses by 40–60%, all while keeping reliability intact.
Managed cloud services often come with added layers and fees, creating a cost floor you can’t escape. Bare metal Kubernetes removes that barrier, offering a leaner, more cost-effective alternative.
Bare Metal Kubernetes for SaaS and AI Startups
Bare metal skips the hypervisor entirely, giving you direct access to hardware like CPU, RAM, and NVMe storage. This makes it perfect for workloads that demand low latency and high concurrency. For example, a fintech API provider moved from VPS-based Kubernetes to bare metal and saw their p99 latency drop to under 3 milliseconds. They also reduced latency variance by 60% and improved throughput by 45%.
AI and machine learning workloads benefit significantly too. Klink AI transitioned from IBM SoftLayer and AWS to bare metal Kubernetes, cutting document processing times from 10 minutes to just seconds – a 10x speed improvement. Plus, their infrastructure costs dropped to one-fifth of what they were paying AWS.
These performance boosts stem from better hardware utilization. Bare metal supports up to 2,400 containers per node, compared to 1,300 on virtualized setups. Pod startup times are also faster, averaging 180 milliseconds versus 420 milliseconds on virtualized nodes. Storage-heavy tasks see even greater benefits, with 2–3x higher IOPS consistency and no "noisy neighbor" issues that often plague shared environments.
This combination of cost efficiency and performance makes bare metal a compelling choice, especially when paired with a risk-free pricing model.
Performance-Based Pricing with Zero Risk
TechVZero takes the guesswork out of infrastructure changes by offering performance-based pricing. They charge only 25% of verified savings for one year, and if the target isn’t met, you pay nothing. This means no upfront financial risk, making it easier for small teams to access full infrastructure support without needing extra hires.
In one case, TechVZero saved a client $333,000 in a single month while also mitigating a DDoS attack during the same engagement. They’ve even operated at a scale of 99,000+ nodes, showcasing their ability to handle massive workloads.
"Removing the virtualization layer delivers tangible performance gains that become crucial for demanding workloads." – Hivelocity
Another major advantage of bare metal? Predictable billing. Unlike managed cloud providers, which often surprise you with egress fees, TechVZero offers flat-rate pricing with generous bandwidth allocations. This predictability makes budgeting and scaling Kubernetes clusters far simpler for startups.
Conclusion
Scaling efficiently takes consistent effort and a strategic approach. Studies show that organizations waste 30–50% of their Kubernetes budgets due to over-provisioning and inefficient scheduling. On average, enterprise clusters operate at just 18% CPU utilization.
To address this, focus on three key optimization layers: Application, Container, and Node. Start with straightforward tasks like deleting unused resources and enabling spot instances for 70–80% of fault-tolerant workloads. Once those are handled, move on to more impactful steps, such as right-sizing pod requests to the 95th percentile of actual usage – an adjustment that can cut costs by 30–50%.
This philosophy of continuous improvement is widely endorsed.
"The most successful cost optimization programs treat FinOps as a continuous practice rather than a one-time project." – Nawaz Dhandala, Co-founder, OneUptime
Automation plays a crucial role in maintaining efficiency. Tools like Karpenter, VPA, and HPA free up lean teams to focus on development rather than infrastructure management. Regularly reviewing costs – ideally, on a weekly basis – helps maintain CPU usage above 60% and memory above 65%. Without ongoing monitoring, configuration drift can lead to wasted resources creeping back into your clusters.
The effectiveness of these strategies is backed by real-world results. For example, a cybersecurity data platform slashed AWS and Azure compute costs by 50% within 24 hours and achieved an 80% reduction within five days. Similarly, a financial services company saved $180,000 annually by optimizing a single over-provisioned nightly ETL job by 85%. These examples highlight how SaaS and AI startups have already reaped substantial savings by implementing these practices.
FAQs
How do I pick the right CPU and memory requests for a workload?
When deciding on CPU and memory requests, base your choices on how your workloads actually behave and what they require for optimal performance. Use monitoring tools to track resource usage over time, and set requests that match these patterns. If you allocate too much, you’ll end up wasting money. On the other hand, allocating too little can lead to crashes and instability.
Make it a habit to regularly revisit and fine-tune these requests. This ensures you’re balancing cost-effectiveness with reliability, keeping pods running smoothly without overloading nodes or leaving resources unused.
When should I use HPA vs. KEDA vs. a node autoscaler like Karpenter?
When it comes to scaling in Kubernetes, the right tool depends on your specific workload and priorities. Here’s a quick breakdown:
- HPA (Horizontal Pod Autoscaler): Ideal for scaling pods based on resource demands like CPU or memory usage. If your application experiences variable resource consumption, HPA dynamically adjusts the number of pods to match demand.
- KEDA (Kubernetes Event-Driven Autoscaler): Perfect for event-driven scaling. It responds to external metrics or events, such as messages in a queue or custom metrics, making it a great choice for workloads with unpredictable or event-based spikes.
- Karpenter: Designed for cluster-level scaling. Karpenter optimizes node types and costs by consolidating workloads and leveraging spot instances, ensuring efficient resource utilization and cost savings.
Each tool serves a unique purpose, so the choice depends on whether you’re focusing on pod-level scaling, event-driven workloads, or overall cluster optimization.
What’s the safest way to use Spot instances without causing outages?
To make the most of Spot instances without risking outages, it’s crucial to manage interruptions effectively. Start by cordoning and draining nodes immediately after receiving a termination notice. This ensures the workloads running on those nodes can be rescheduled promptly.
Additionally, design workloads to be resilient, enabling them to recover or restart quickly when needed. Implement autoscaling to adapt to changing demands and diversify your instance types and availability zones to spread risk.
By following these steps, you can reduce disruptions and take full advantage of the cost savings Spot instances offer.