Post-Spike ROI: How to Run a Retro That Prevents the Next Cost Incident

Cloud cost spikes can eat into your margins fast. Here’s how to prevent them from happening again. A post-spike retrospective helps you identify the root cause of cost anomalies, fix issues, and set up safeguards to avoid future surprises. Cloud waste is a major issue, with 27% of cloud spend wasted on idle resources, and CFOs reporting spikes that increase bills by up to 200%.
To fix this, you’ll need:
- The right team: FinOps experts, engineers, finance, and product managers.
- Clear goals: Examples include reducing tagging errors and keeping cost alerts actionable.
- Tools like AWS Cost Explorer to pinpoint the problem.
- Actionable steps: Automate tagging, set up alerts, and enforce resource policies.
For instance, tagging failures can cost thousands monthly if unaddressed. Retrospectives ensure spikes are resolved quickly (within hours, not days) and prevent them from recurring. By following these steps, you’ll save money, improve accountability, and keep cloud costs under control.
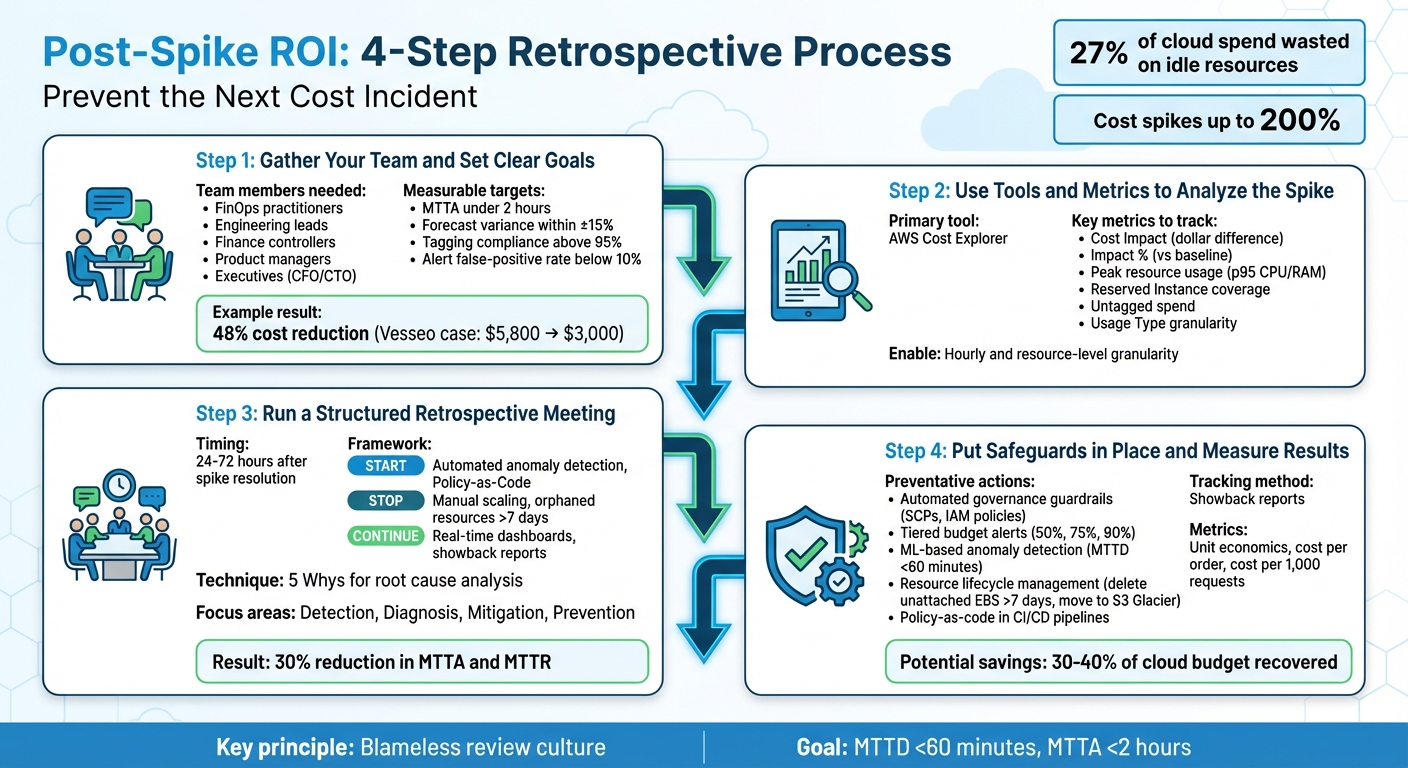
4-Step Post-Spike Retrospective Process for Cloud Cost Management
Cloud Cost Management Demo
sbb-itb-f9e5962
Step 1: Gather Your Team and Set Clear Goals
To run an effective retrospective, you need the right mix of people. Key participants include FinOps practitioners, engineering leads, finance controllers, product managers, and executives. Each brings a unique perspective to the table:
- FinOps practitioners provide detailed usage and spending reports.
- Engineering leads focus on technical decisions and fixing issues.
- Finance controllers validate expenses against budgets.
- Product managers add business insights, helping to differentiate between planned feature costs and unexpected waste.
- Executives – like CFOs or CTOs – offer strategic guidance for reallocating budgets.
In most cases, the FinOps practitioner leads the retrospective, ensuring the team focuses on improving processes rather than placing blame. This collaborative approach is key to identifying and preventing future cost issues.
Who Should Participate?
Each stakeholder plays a critical role:
- Engineering leads investigate and resolve root causes, such as misconfigured auto-scaling or over-provisioned resources.
- Finance controllers ensure cost data is accurate and assess its impact on the bottom line.
- FinOps specialists document findings and integrate them into governance practices.
Take the example of Dr. Christine Oji, a Cloud FinOps Engineer, who tackled a 21% spike in monthly S3 storage costs in July 2025. By working with the sprint team responsible for an untagged S3 bucket storing 20TB of data, she eliminated waste by enforcing tagging through Infrastructure as Code templates:
"Missing tags aren’t just metadata issues. They’re operational blind spots." – Dr. Christine Oji, Cloud FinOps Engineer
With the right team assembled, the next step is to set clear, actionable goals.
Define Specific Targets
Using the expertise of your team, set measurable goals that drive quick responses and improve cost accuracy. Examples of specific targets include:
- Achieving a Mean Time to Acknowledge (MTTA) under 2 hours.
- Reducing forecast variance to within ±15%.
- Maintaining tagging compliance above 95% to minimize unallocated costs.
- Keeping the false-positive rate for alerts below 10% to ensure actionable insights.
In 2025, Cheesecake Labs partnered with Vesseo, a blockchain wallet company, to implement FinOps strategies using AWS tools. By addressing inefficiencies and optimizing resources, they slashed Vesseo‘s monthly AWS bill from $5,800 to $3,000 – a 48% reduction.
You can also calculate cost avoidance to show the value of your retrospective. Multiply the anomaly’s daily cost by the number of days the issue would have persisted. For example, if a $1,000 daily spike lasted five days, the retrospective saved $5,000. This calculation not only highlights savings but also proves the effectiveness of your process, showcasing the ROI of your efforts while supporting cost efficiency and operational improvements.
Step 2: Use Tools and Metrics to Analyze the Spike
Once your goals are set, it’s time to dive into your cost data. The key is figuring out what caused the spike, when it started, and which resources are responsible. AWS Cost Explorer is a great tool for this, offering visual insights and filtering options to help you get answers quickly.
How to Use AWS Cost Explorer
Begin with the "Monthly Costs by Service" report to identify which AWS service is behind the spike. Then, switch to the daily view to pinpoint when the spike began.
For deeper insights, enable hourly and resource-level granularity to track the specific resource and the timing of the usage changes. If you received an anomaly alert, use the "View in Cost Explorer" link. This opens a pre-filtered time-series graph, which you can further narrow down by Service, Region, Linked Account, Usage Type, and Cost Allocation Tags to isolate the issue.
Here’s an example: If your S3 costs have surged, group by "Usage Type" to figure out whether it’s due to increased storage, API calls, or data transfer. Let’s say you notice a sharp rise in DataTransfer-Out-Bytes – now you’ve identified a major technical contributor. AWS Cost Explorer provides 13 months of historical data and updates every 24 hours, making it easier to track trends and changes over time.
Once you’ve identified the root cause, shift your focus to the metrics that measure both the financial and operational impact of the spike.
Which Metrics Matter Most
To assess the spike’s impact, start with Cost Impact – the dollar difference between your actual and expected spending. This metric helps you gauge how severe the spike is. Then, look at Impact %, which shows how the spike compares to your usual spending patterns. Keep in mind that even a small dollar increase can represent a significant percentage change, depending on your baseline spend.
Next, compare peak resource usage (like p95 CPU or RAM) against your provisioned capacity to identify inefficiencies or waste. Review your Reserved Instance and Savings Plan coverage to ensure workloads aren’t unintentionally moving to higher On-Demand pricing. Check for untagged or "Other" spend categories, as high untagged costs often signal a lack of accountability. Finally, use Usage Type granularity to pinpoint the exact operation – like RunInstances or NAT Gateway egress – that drove up costs.
"Anomaly-driven triage finds the runaways (GPU bursts, NAT egress, stuck jobs) and converts them into savings tickets with dollar impact." – Cloudaware
For an even more detailed breakdown, query the AWS Cost and Usage Report (CUR) to analyze resource-level drivers and internal cost allocations. Just remember, while the AWS Cost Explorer UI is free to use, programmatic API queries cost $0.01 per paginated request.
Step 3: Run a Structured Retrospective Meeting
Once you’ve wrapped up your analysis, it’s time to transform those insights into actionable steps. Schedule the retrospective meeting 24–72 hours after resolving the spike. This window strikes the perfect balance – details are still fresh, but there’s enough distance to focus on improving systems rather than rehashing the incident. Kick off the session by emphasizing that it’s a no-blame discussion aimed at learning and improvement.
Assign roles for the meeting: a facilitator (preferably someone outside the incident response team) and a note-taker. Start by reviewing the incident timeline – when the spike was detected, escalated, mitigated, and resolved. This helps everyone align on the facts before diving into the analysis. The goal here is simple: identify weaknesses and turn them into preventative measures to avoid future cost spikes.
Apply the Start, Stop, Continue Method
Organize your findings using the Start, Stop, Continue framework. Here’s how it works:
- Start: Introduce new safeguards. For example, set up automated anomaly detection that sends alerts through Slack or Jira. You could also implement Policy-as-Code to block untagged resource creation during deployment.
- Stop: Eliminate inefficient practices. This might include avoiding manual scaling for predictable workloads or ensuring orphaned resources like unattached EBS volumes or idle load balancers don’t linger for more than seven days.
- Continue: Build on what’s already working. For instance, maintaining real-time cost dashboards and cross-functional showback reports can keep engineering teams accountable and informed.
This framework helps streamline your approach and ensures no stone is left unturned.
Find Gaps in Your Processes
To dig deeper, use the 5 Whys technique to uncover the root causes of the spike. Focus on four key areas:
- Detection: Could the spike have been flagged sooner? Were alarm thresholds set too high?
- Diagnosis: Was the root cause immediately clear? Did you have the right dashboards in place?
- Mitigation: How quickly were you able to curb the spending? Were there any obstacles slowing the response?
- Prevention: What changes can you make to ensure this doesn’t happen again?
Don’t just stop at technical issues – look for hidden problems like process debt, unclear ownership, or misaligned incentives. Ask questions like, “Where did we get lucky?” to identify near-misses that might signal deeper vulnerabilities.
Finally, every follow-up action needs a specific owner and deadline. Vague suggestions like “improve planning” won’t cut it. Industry data suggests that targeted routing and automation can reduce Mean Time to Acknowledge and Mean Time to Resolve by 30% for cost-related incidents. Assigning clear responsibilities and timelines is key to making those improvements stick.
Step 4: Put Safeguards in Place and Measure Results
To prevent future cost spikes, it’s essential to act on the lessons learned from your retrospective analysis. By addressing identified weaknesses and implementing safeguards, you can protect your cloud budget while tracking the financial impact of these measures. Here’s how to take concrete steps to safeguard your cloud spending.
Which Preventative Actions to Prioritize
Start by setting up automated governance guardrails to catch potential issues before they escalate. Use tools like Service Control Policies (SCPs) and IAM policies to block unauthorized resource deployment. Enforce tagging policies with mandatory cost-center tags to maintain control over resource allocation and accountability.
Establish tiered budget alerts at 50%, 75%, and 90% of your monthly target. This ensures you catch anomalies early. However, static budgets aren’t enough – integrate ML-based anomaly detection tools like AWS Cost Anomaly Detection. These tools can identify cost spikes, which can range from 18% to 200% of your monthly bill, in real-time. High-performing teams aim for a Mean Time to Detect (MTTD) of less than 60 minutes for cost anomalies.
Implement resource lifecycle management to eliminate wasted resources automatically. For example:
- Delete unattached EBS volumes older than seven days.
- Move infrequently accessed data (over 30 days old) to cheaper storage options like S3 Glacier Deep Archive, which can save up to 95% compared to standard storage.
- Remove orphaned snapshots to recover unused spending.
Since poor resource management can waste 30%–40% of cloud budgets, automated cleanup policies are essential for reclaiming these costs.
Integrate policy-as-code into your CI/CD pipelines to prevent cost overruns. This involves blocking deployments that lack required tagging or exceed predefined resource limits. Use a Configuration Management Database (CMDB) or virtual tagging to link every resource to a specific application, environment, and owner email. This ensures alerts are sent directly to the responsible engineer, enabling quick action.
Use Showback Reports to Track Savings
Once safeguards are in place, you need to measure their impact. Showback reports are a powerful way to make these savings visible to all stakeholders. Unlike chargeback, which directly bills teams, showback is informational – it attributes cloud spending to specific teams or projects, fostering awareness and shared accountability. Use dashboards to break down costs by business unit, application, or environment, ensuring each team sees data relevant to their operations.
Track unit economics to highlight efficiency gains, even if total cloud spending increases. Use metrics like cost per order, cost per 1,000 requests, or cost per vCPU-hour to demonstrate improvements. For instance, if the cost per request drops after rightsizing instances, it’s clear that optimization efforts are paying off.
To calculate ROI, subtract the cost of implementing your program from the hard savings achieved (e.g., through rightsizing, better commitment coverage, or waste elimination), then divide by the program cost. Monitor week-over-week percentage changes and compare month-to-date spending against previous months to identify trends early. Use amortized cost data instead of unblended costs to accurately account for Reserved Instances and Savings Plans. As the FinOps Foundation puts it, the amortized effective rate is "the only number worth defending in an executive meeting".
Automate the delivery of these reports through Slack or email – weekly for engineers and monthly for executives. This routine sharing of actionable data can reduce Mean Time to Acknowledge and Mean Time to Resolve cost incidents by about 30%. When teams consistently receive relevant insights, they can make informed decisions without waiting for the next review cycle.
Conclusion: Make Retrospectives Part of Your Routine
Main Points to Remember
Running a productive post-spike retrospective boils down to four essential steps:
- Assemble the right team: Include representatives from Finance, DevOps, and Engineering to ensure all perspectives are covered.
- Leverage AWS Cost Explorer: Identify the top three cost drivers and connect them to specific deployments for actionable insights.
- Structure your meeting: Follow a proven framework to dig into the root causes behind cost anomalies.
- Implement safeguards: Continuously monitor their effectiveness using showback reports and unit economics.
A blameless review is key to success. As Norm Kerth wrote in Project Retrospectives: A Handbook for Team Review:
"Regardless of what we discover, we understand and truly believe that everyone did the best job they could, given what they knew at the time, their skills and abilities, the resources available, and the situation at hand."
When team members feel safe to share honestly, they’re more likely to uncover systemic issues instead of focusing on individual mistakes. This approach leads to meaningful and lasting improvements.
By following these steps, cost management can become a natural part of your team’s daily workflow.
Build Cost Management into Your Operations
Take the insights from retrospectives and embed them into your ongoing DevOps processes. Make cost management a regular part of every sprint and planning session. Mature FinOps teams aim for a Mean Time to Detect of under 60 minutes and a Mean Time to Acknowledge under two hours. With targeted automation and clear ownership, you can reduce these response times by as much as 30%.
Document lessons learned and refine your governance playbook. Dr. Christine Oji, a Cloud FinOps Engineer, highlights the importance of this step:
"What does this cost anomaly reveal about how we build, tag, and govern in the cloud?"
Each retrospective should produce actionable outcomes – like OpsItems, Jira tickets, or updates to policy-as-code rules. By closing the loop from detection to prevention, you’re not just solving today’s issues. You’re fostering a culture of cost awareness where cloud spending is a shared responsibility, not a surprise at the end of the month.
FAQs
How do I know a cost spike is an incident vs expected growth?
A cost spike typically occurs when expenses surpass normal usage patterns. It’s often flagged as an anomaly by machine learning tools, and further investigation might uncover unexpected causes such as misconfigurations, unauthorized deployments, or idle resources consuming unnecessary costs. On the other hand, expected growth reflects planned increases in spending due to predictable factors like business expansion, traffic surges, or deliberate scaling of usage.
What’s the fastest way to pinpoint the exact AWS resource causing the spike?
To pinpoint the AWS resource causing a sudden cost spike, AWS Cost Anomaly Detection is your best bet. This tool uses machine learning to spot unusual patterns and delivers a detailed root cause analysis. It even highlights up to ten possible reasons for each anomaly, making it easier to identify the issue and address it swiftly.
How do we prove ROI from a post-spike retrospective in dollars?
To show ROI in clear dollar terms, focus on quantifiable savings or costs avoided through corrective actions like better resource allocation or configuration updates. Leverage tools like billing reports or cost monitoring platforms to track these improvements and convert them into monetary values. Highlight measurable metrics that demonstrate reduced waste or enhanced cost control within your cloud setup.