Reducing Build Costs by 50%: A CI Optimization Playbook
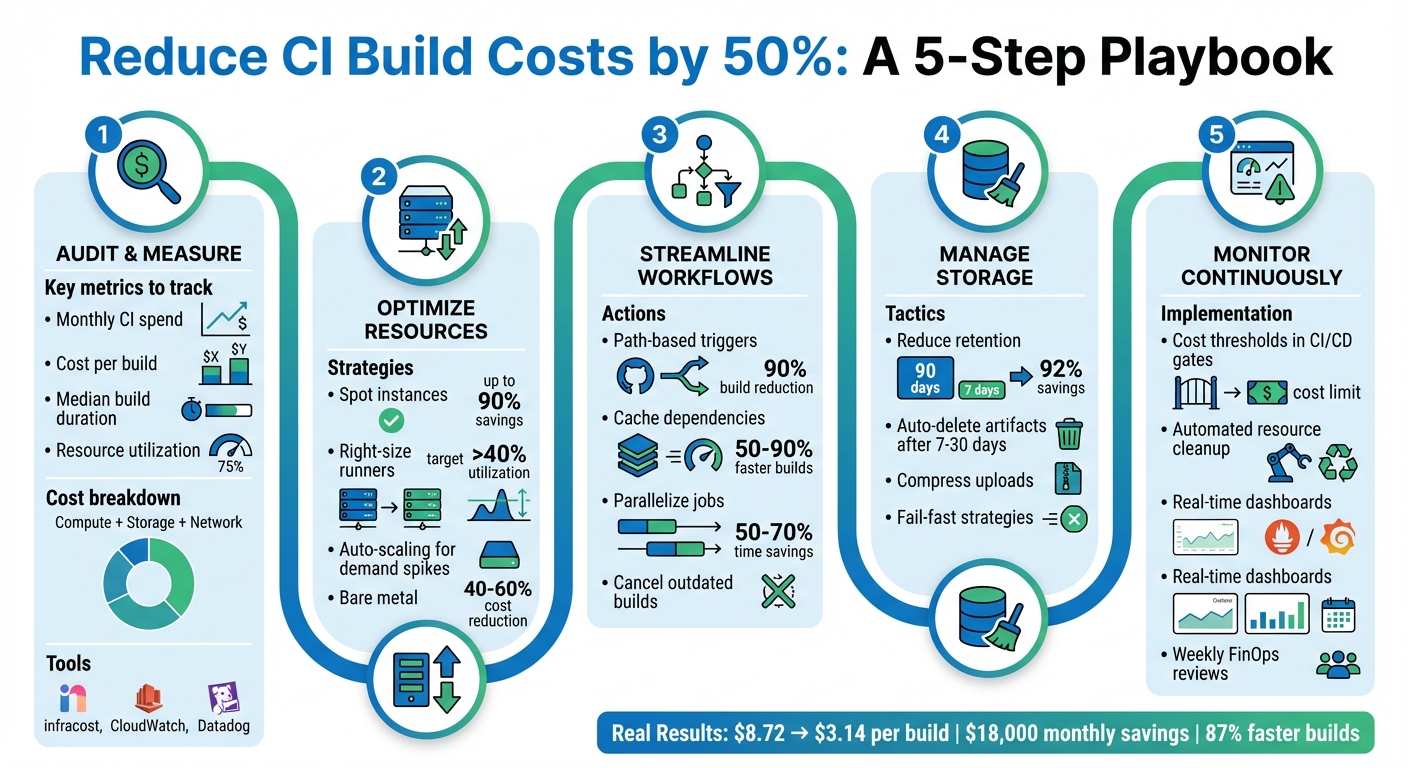
Reducing CI pipeline costs by 50% is possible by addressing inefficiencies like redundant builds, over-provisioned resources, and idle infrastructure. Key strategies include:
- Audit and Measure Costs: Identify compute, storage, and network expenses. Tools like
infracostand CloudWatch can help track real-time spending. - Optimize Resources: Use spot instances, right-size runners, and auto-scaling to match workloads. For larger teams, bare metal infrastructure can cut costs by 40–60%.
- Streamline Workflows: Implement path-based triggers to avoid unnecessary builds, cache dependencies to reduce setup times, and parallelize jobs to speed up builds.
- Manage Storage: Reduce artifact retention periods and automate cleanup of unused resources.
- Monitor Continuously: Use cost thresholds, automated alerts, and dashboards to maintain savings over time.
For example, by combining caching and smarter triggers, one team reduced deployment costs from $8.72 to $3.14 per build, saving $18,000 monthly. These methods not only cut costs but also improve pipeline efficiency, saving time for developers. Start by auditing your current CI setup and applying these steps incrementally.
5-Step CI Pipeline Cost Optimization Framework
8 Fixes for Faster CI/CD Pipelines
Measuring Your Current CI Pipeline Costs
Before diving into optimization, it’s crucial to measure how much you’re currently spending on your CI pipeline. Many teams are shocked to find they’re spending more than they thought. Without centralized reporting and real-time analytics, tracking costs and spotting inefficiencies across multiple teams becomes a daunting task.
Setting Up Cost Baselines
To get started, calculate four key metrics: monthly CI spend, cost per build, median build duration, and resource utilization. Your total CI spend generally breaks down into three categories:
- Compute costs: Determined by build duration multiplied by the runner’s rate.
- Storage costs: Includes artifacts, dependency caches, and logs. For example, GitHub Actions charges about $0.008 per GB per day.
- Network transfer fees: Costs for moving data across regions or to the internet.
It’s worth noting that platforms often round up compute time. For instance, a 61-second build may cost the same as a 120-second build. Storage costs can also pile up quickly, but you can reduce them significantly. For example, cutting artifact retention from 90 days to just 7 days could lower storage costs by 85–90%.
Keep an eye on resource usage during builds – CPU, memory, and disk I/O are key metrics. Tools like Amazon CloudWatch or Datadog can help you determine if your jobs are fully utilizing their assigned runners. If CPU or memory usage is consistently below 20%, you’re over-provisioned and wasting money.
For better cost management, set up resource tagging with labels like "Environment", "Owner", "CostCenter", and "Expiry/TTL." This makes it easier to allocate costs and automate cleanup.
To visualize and track costs, tools like infracost offer real-time pipeline cost insights. Native dashboards, such as the AWS CodeBuild console or GitHub Actions billing page, also provide spending breakdowns. Additionally, configure automated alerts in tools like CloudWatch or Azure Monitor. For example, you could set an alert to trigger if estimated charges exceed $500 per month.
Once you’ve established these baselines, you’ll have a clearer picture of what’s driving your CI expenses.
Finding What Drives Your Costs
Armed with your baselines, the next step is identifying the factors that inflate your CI costs. Common culprits include over-provisioned resources, idle infrastructure, unnecessary build triggers, and inefficient workflows.
Take the example of a DevOps engineer in January 2026 who revamped their CI pipeline. By implementing smarter caching, using dorny/paths-filter for change detection, and enabling parallel execution, they reduced the cost per deploy from $8.72 to $3.14. This also cut their change failure rate from 15% to 3.2%. The team saved $18,000 per month and increased deployment frequency from 2 to 14 times per day.
"Every redundant process in your pipeline is a cost multiplier." – dredyson.com
To pinpoint inefficiencies, analyze the ratio of build runs to pull requests. A high number of runs per PR or frequent push-triggered builds on feature branches can indicate wasted compute. Break down spending by runner type as well – macOS runners are significantly more expensive than Linux runners ($0.062/min vs. $0.006/min for 2-core instances as of January 2026).
Finally, keep an eye on pipelines with high failure rates or long build times. Resource exhaustion, such as maxed-out CPU or memory, is responsible for 63% of pipeline failures. Addressing these inefficiencies can dramatically improve both performance and cost efficiency.
Allocating Resources More Efficiently
Once you’ve pinpointed areas of inefficiency, the next step is to reallocate compute resources to better align with workload demands. This approach opens the door to strategies like using spot instances, right-sizing resources, and exploring bare metal solutions.
Using Spot and Preemptible Instances
Spot instances, which are essentially unused cloud capacity, can offer discounts of up to 90% compared to standard pricing. However, these instances can be reclaimed with little notice – AWS provides a two-minute warning, while GCP and Azure give just 30 seconds [19,22].
In March 2024, Rippling managed to cut EC2 costs by 60% and overall cloud expenses by 50% by migrating their CI/CD workloads to AWS Spot Instances. During peak activity, their infrastructure scaled to over 1,200 virtual machines, equivalent to 50,000 CPUs. They achieved this by implementing checkpointing, diversifying instance types, and configuring job retries to handle interruptions.
"By implementing these Spot Instance optimizations, Rippling has future-proofed themselves and ensured even greater savings as their operation continues to scale up." – Buildkite
If you’re considering spot instances, start small – transition 10–20% of your agent fleet and closely monitor build stability before scaling further. Use node taints to ensure only stateless test jobs run on spot nodes, while reserving on-demand instances for critical services [23,24]. Additionally, set CI jobs to retry after failures like "agent_stop" or connection errors, and configure spot instances to "Terminate" upon reclamation to avoid unnecessary storage costs.
Right-Sizing Your Compute Resources
Over-provisioning compute resources is a common issue, with some teams operating CI runners at less than 20% utilization. By analyzing resource usage metrics from the baseline phase, you can identify where resources are being wasted.
Match runner sizes to the actual demands of your jobs. A hybrid approach often works best: maintain a baseline of Reserved Instances or Savings Plans for consistent workloads, while using spot instances to handle spikes. This way, you avoid paying for idle resources during quieter periods but still have enough capacity for peak times.
Auto-scaling adds another layer of efficiency by dynamically adjusting resources. It can spin up additional runners when build queues grow and shut them down when demand decreases. This prevents pipeline delays while keeping costs under control.
Moving to Bare Metal Infrastructure
For teams running thousands of builds daily, bare metal infrastructure can offer substantial cost savings – often between 40% and 60% compared to managed cloud services. TechVZero’s bare metal Kubernetes solutions deliver the same reliability as managed platforms, but at a much lower cost. One client, for example, saved $333,000 in just a single month by making the switch.
Eliminating Wasteful Build Triggers
Triggering full CI pipelines for every code push can be overkill, especially for minor updates like documentation tweaks or README changes. Yet, many teams still run full builds for every commit. This not only wastes time but also racks up costs – especially when macOS runners cost $0.062 per minute compared to $0.006 for Linux.
"Run what changed, skip what did not. Path filtering makes CI/CD efficient." – Nawaz Dhandala
The solution lies in smart filtering at both the workflow and job levels. This is particularly vital for monorepos, where changes in one area (e.g., frontend) shouldn’t trigger unrelated tests (e.g., backend). Configuring path filtering effectively can reduce build times by as much as 90% in large repositories. For example, one team of 10 developers slashed their monthly CI costs from $158 to $32 – an 80% savings – by limiting full CI runs to pull requests and main branches. Combined with caching and better storage management, this approach is a cornerstone of reducing CI costs by half.
Setting Up Path-Based Triggers
Path-based triggers let you fine-tune when workflows are executed. Use paths to specify directories that should trigger builds and paths-ignore to skip builds for files like .md documents, licenses, or .gitignore updates.
For repositories with required status checks, skipping an entire workflow can leave checks stuck in a "Pending" state. Instead, tools like dorny/paths-filter allow workflows to run while skipping expensive jobs, ensuring status checks pass. In monorepos, separate workflows for different services – like /frontend and /backend – help avoid unnecessary tests for unaffected components.
You can also use git diff in a "detect" job to programmatically identify which services need rebuilding. Pass this information to subsequent jobs using outputs. To save time and bandwidth, set fetch-depth: 1 during the checkout process in large repositories.
Another handy trick is implementing concurrency groups with cancel-in-progress: true. This stops outdated builds when new commits are pushed to the same branch, saving both time and money. Once triggers are optimized, focus shifts to caching dependencies for even greater efficiency.
Caching Dependencies and Artifacts
Caching dependencies can dramatically cut down build times – by as much as 50–90%. Instead of re-downloading dependencies in every job, use tools like actions/upload-artifact to share build artifacts across jobs.
Lockfiles like package-lock.json, poetry.lock, or go.sum are perfect for generating cache keys. This ensures the cache is only invalidated when dependencies actually change. For Node.js projects, caching the node_modules directory can skip the "linking" phase, slashing setup time from minutes to seconds.
Here’s a real-world example: a Next.js monorepo reduced its CI/CD time from 14 minutes to just 1 minute and 45 seconds – an 87% reduction – by leveraging proper caching and parallelization. For Docker workflows, remote caches or Buildx can reuse layers between runs, avoiding unnecessary pulls and rebuilds.
| Language | Cold Install/Compile | Cached Time |
|---|---|---|
| Node.js | ~3–3.5 minutes | ~30 seconds |
| Python | 1–3 minutes | ~20 seconds |
| Go | 1.5–6 minutes | ~30 seconds |
| Rust | 6–22 minutes | 1–3 minutes |
Take a 4-job Node.js workflow running 40 times daily: redundant setup costs $65 per month on Linux runners. By switching to a "build-first" artifact pattern, costs drop to $25. On macOS runners, savings jump from $670 to $257 per month. With caching in place, the next step is managing storage to avoid runaway costs.
Managing Storage Usage
Even with efficient builds, storage costs can spiral if left unchecked. For example, retaining 5GB of daily artifacts for the default 90-day period results in 450GB of storage. Reducing retention to just 7 days cuts this to 35GB – a 92% savings.
Set up automatic deletion of artifacts and logs after 7–30 days instead of sticking with the default 90-day retention. Only upload essential files – like test failures instead of full logs – and use high compression levels. For temporary artifacts, set retention-days: 1 to clear them after the workflow run.
Fail-fast strategies can also save resources. If one job fails, stop all remaining jobs in the workflow immediately. This not only conserves compute resources but also reduces storage usage. According to Datadog’s 2024 DevOps Report, 63% of pipeline failures stem from resource exhaustion, highlighting the importance of proactive storage management.
sbb-itb-f9e5962
Speeding Up Builds with Parallelism and Caching
When it comes to improving build efficiency, speeding up the process through parallelism and smart caching can make a huge difference.
Long build times aren’t just frustrating – they waste both compute resources and developer time. For example, a team of 10 developers running 50 builds each day could lose 92 hours of productivity every month if builds take 18 minutes instead of 7. By running jobs in parallel and caching unchanged components, you can significantly cut down on build times.
"Slow CI pipelines kill developer productivity. Every minute spent waiting for builds is a minute not spent shipping features." – Nawaz Dhandala, OneUptime
Parallelism and caching complement each other perfectly. Running tests simultaneously reduces overall build time, while caching avoids redundant downloads and rebuilds. In one instance, a Next.js monorepo improved build times from 14 minutes to just 1 minute and 45 seconds – an 87% reduction – by combining dependency caching, Docker layer caching, and parallel job execution. This also slashed daily compute usage from 560 minutes to only 70 minutes.
Running Tests and Jobs in Parallel
Parallelism is all about running tasks at the same time. For example, you can execute linting, unit tests, and integration tests concurrently, which can reduce build times by 50–70%. Matrix strategies make it possible to test across multiple Node.js versions (like 18, 20, and 22) and operating systems (Ubuntu, Windows, macOS) without increasing total build duration.
Identifying independent jobs is key. If your frontend tests don’t rely on backend compilation, run them in parallel. For large test suites, splitting tests into smaller chunks and running them across multiple runners can cut a 20-minute process down to just 5 minutes.
Once your tests are running in parallel, adding distributed caching can further streamline the process.
Setting Up Distributed Caching
Cache keys, such as those generated from lockfiles like package-lock.json, refresh only when dependencies change. Combining this with parallel test execution reduces both build times and redundant downloads.
In Docker workflows, layer caching is a game-changer. To make the most of it, structure your Dockerfile so that dependency manifests are copied first, followed by installation commands, and then the source code. This ensures that the installation step only re-runs when dependencies are updated.
Enable BuildKit by setting DOCKER_BUILDKIT=1 and use RUN --mount=type=cache to persist package manager directories between builds without adding unnecessary bulk to your final image. For GitHub Actions workflows, you can use type=gha for the built-in 10GB cache or type=registry for larger images. Additionally, a .dockerignore file can exclude unnecessary directories like .git or node_modules, saving up to 90 seconds during context transfers.
Running Faster Workflows on Bare Metal
If you’re using hosted runners, keep in mind they typically start with a clean slate, meaning each build begins "cold." On the other hand, self-hosted runners on bare metal infrastructure maintain persistent local storage between builds, eliminating the need to repeatedly upload and download caches. This approach reduces network latency and ensures faster builds.
Bare metal runners also avoid queue wait times, which can add 10–15% overhead for teams running many builds daily. With persistent BuildKit stores, you get instant access to caches without waiting for registry pulls. The result? Faster builds, lower compute usage, and reduced CI costs – helping you hit ambitious savings targets like cutting costs by 50%.
Monitoring Costs Continuously
Once you’ve optimized resource allocation and build triggers, the next step is keeping those savings intact. Continuous monitoring plays a key role here, as it helps prevent cost overruns. Without regular oversight, organizations risk wasting 30–40% of their cloud budgets. With active monitoring, that figure drops to under 10%.
"Cloud costs have a way of growing silently… The problem is not cloud pricing itself. The problem is visibility." – Nawaz Dhandala, OneUptime
Shifting from reactive monthly reviews to proactive, automated controls can make all the difference. These controls catch costly changes before deployment, clean up idle resources automatically, and track key metrics in real time.
Adding Cost Thresholds to CI/CD Gates
The best way to stop cost increases is to catch them early – during code review, not after deployment. Tools like Infracost can be integrated into your pull request workflow to estimate costs from Terraform plans and flag any changes before resources are provisioned. For example, you can use shell scripts with jq to parse JSON output and compare the diffTotalMonthlyCost against a set budget, such as $500 per change.
"Budget conversations usually happen after costs have already exceeded limits. Cost guardrails trigger when changes breach your budget threshold – before code merges." – Infracost
You can also set up tiered approval gates based on cost impact. For instance, small increases under $100 might be auto-approved, while changes exceeding $1,000 per month could require team leads or directors to review them. This can be automated through pull request labeling. For stricter governance, consider Policy as Code using Open Policy Agent (OPA) and Rego to enforce rules like banning expensive instance types (e.g., AWS x1 instances) or requiring cost-center tags. Configure your CI/CD tools – whether it’s GitHub, GitLab, or Azure DevOps – to block merges when cost policies are violated.
One example: a team reduced their cost per deployment from $8.72 to $3.14, saving $18,000 monthly, by combining automated cost checks with smarter caching.
Automating Resource Cleanup
Idle resources, especially during weekends or off-hours, are a common source of waste. You can schedule teardown jobs in your CI configuration using cron syntax (like 30 15 * * 5) to automatically destroy non-production environments every Friday at 3:30 PM, cutting weekend idle costs. Even seemingly minor resources, like NAT Gateways costing $35 per month, can add up if left running unnecessarily.
Another option is using Time-to-Live (TTL) policies in Terraform to automatically decommission test environments after 24 hours. Similarly, you can configure policies to delete build artifacts after 7–30 days. For example, reducing retention from 90 days to just 7 can slash storage costs by 92%. Automated scale-downs for runner fleets during off-peak hours also help eliminate compute waste when no one is actively pushing code.
Tracking Metrics for Long-Term Savings
To maintain efficiency, track key metrics like cost per build, runner utilization, and waste percentage. For example, if your cost per build varies by more than 20% from the baseline, it’s a red flag. Similarly, if CPU and memory usage consistently stay below 40%, you’re likely over-provisioned and paying for unused capacity. Aim to keep waste under 10% by automating resource cleanup.
For better visibility, export cost data from CI jobs to Prometheus and create real-time Grafana dashboards to monitor for cost anomalies. Also, track commitment coverage – the percentage of workloads covered by Reserved Instances or Savings Plans – and review these monthly to ensure your commitments align with usage patterns. Boeing, for example, saved $958,250 annually within 90 days by consolidating multi-cloud billing data and right-sizing compute resources across AWS, Azure, and GCP.
Finally, establish weekly FinOps reviews where engineering leads analyze costs per team, workflow, and failure rates. Since 63% of pipeline failures are caused by resource exhaustion, monitoring CPU and memory usage can prevent outages and reduce waste. These steps ensure cost discipline becomes a regular part of your development process, rather than a one-time effort.
Conclusion
Cutting CI build costs by 50% requires a focused, data-driven approach. The strategies outlined here work because they tackle the core issues that drive up expenses: unnecessary builds, over-resourced infrastructure, idle systems, and limited visibility.
Adopting techniques like intelligent batching, ARM-based compute, and smarter caching can lead to cost reductions of up to 88%, 32%, and 43%, respectively. For instance, one team brought their deployment costs down from $8.72 to $3.14, saving $18,000 every month. Boeing also reported $958,250 in annual savings within just 90 days by consolidating billing data and optimizing compute usage across AWS, Azure, and GCP. These examples highlight the real-world impact of targeted pipeline improvements.
Beyond cost savings, these optimizations enhance overall performance. Faster build times reduce context switching for engineers, while better resource allocation minimizes pipeline failures. Continuous monitoring ensures that costs stay under control and issues are caught before they escalate into production problems.
The first step is gaining visibility into your current costs. Measure where your budget is going, pinpoint the largest inefficiencies, and address them one by one. Use path-based triggers, optimize compute resources, automate cleanup tasks, and maintain ongoing monitoring – each of these steps has been covered in detail throughout this guide. Achieving a 50% reduction in CI costs is not just a goal; it’s entirely within reach when you approach it with the same diligence as managing production incidents. Start implementing these strategies today and turn your CI pipeline into a lean, high-performing system.
FAQs
Which CI cost metric should I fix first?
When it comes to managing costs, build duration is the metric you should prioritize. Why? Because it directly impacts compute expenses and the amount of resources your pipeline consumes.
Sure, reducing unnecessary build triggers and optimizing how resources are allocated can make a difference. But shortening build duration often leads to the fastest and most noticeable savings. By streamlining your pipeline, you not only save on costs but also boost overall efficiency by cutting down on wasted resources.
How do I use spot instances without flaky builds?
To make the most of spot instances while minimizing disruptions, it’s crucial to have strategies in place to handle interruptions. Start by diversifying instance types and availability zones to reduce dependency on a single resource. Automation tools like Kubernetes controllers can simplify managing these instances.
Another key approach is checkpointing, which involves saving progress at regular intervals. This way, workflows can resume from these checkpoints instead of starting over. For CI pipelines, design workflows to retry failed steps and pick up from where they left off.
Tools such as AWS Node Termination Handler and Karpenter are particularly useful for managing terminations. They help ensure your processes remain stable while still leveraging the cost benefits of spot instances.
How can I skip builds without breaking required checks?
You can avoid triggering builds without affecting required checks by using labels like [skip ci] or [ci skip] in your commit message. Adding one of these labels ensures the build doesn’t run, while still letting merge checks pass smoothly. Just include the label in your commit message before pushing to save on CI resources without causing any disruptions.