Spot Coverage Metrics Every Founder Should Monitor

Spot instances can save up to 90% on cloud costs, making them ideal for workloads like AI/ML training, batch processing, and CI/CD pipelines. However, their unpredictable nature – due to interruptions with only a two-minute warning – requires active monitoring and diversification to avoid cost spikes and downtime. Founders should track these four key metrics to optimize usage:
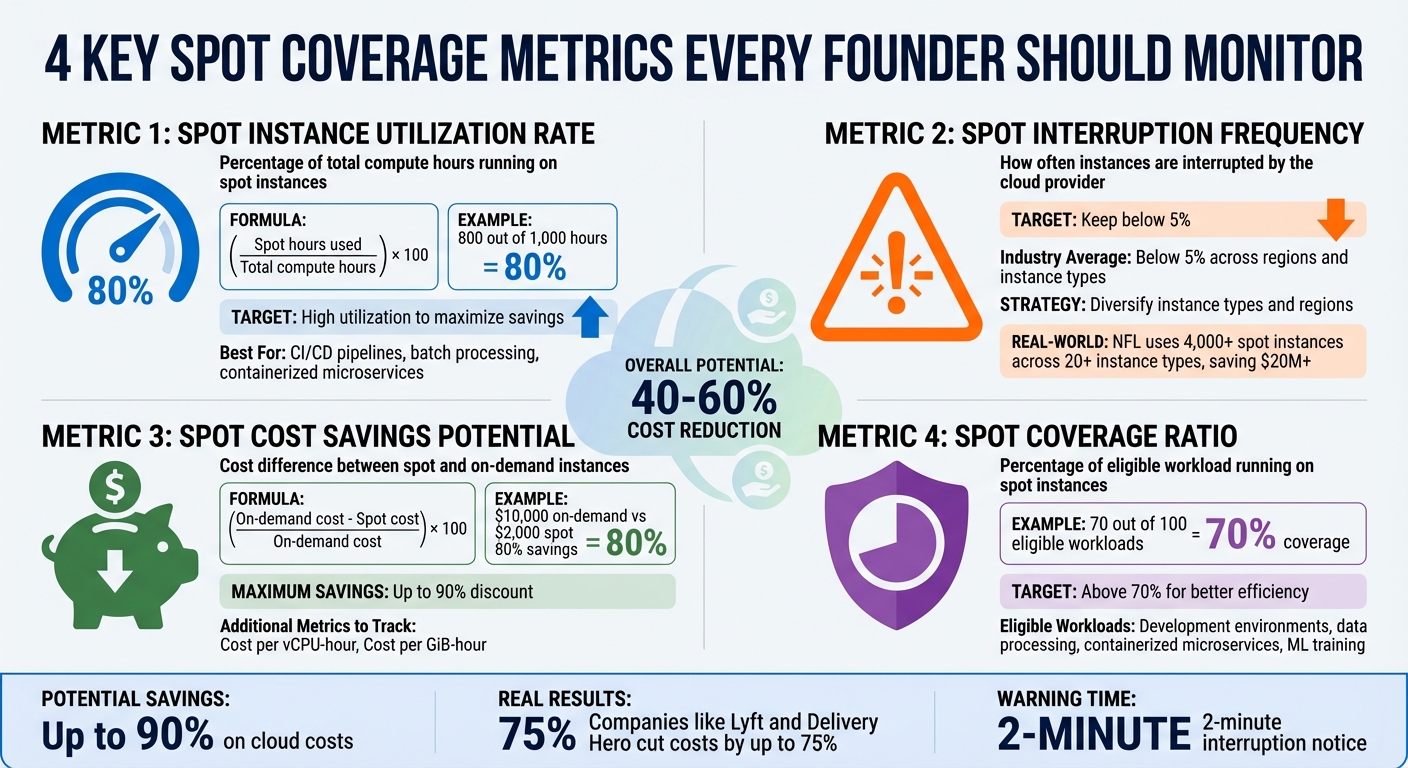
- Spot Instance Utilization Rate: Percentage of total compute hours running on spot instances. Aim for high utilization to maximize savings.
- Spot Interruption Frequency: Measures how often instances are interrupted. Keep this below 5% by diversifying instance types and regions.
- Spot Cost Savings Potential: The percentage saved compared to on-demand pricing. Regularly analyze cost per vCPU-hour and memory usage.
- Spot Coverage Ratio: How much of your eligible workload runs on spot instances. Target above 70% for better efficiency.
Tools like Amazon CloudWatch, EventBridge, and Spot Placement Scores help monitor these metrics. Automation (e.g., Capacity Rebalancing) ensures workloads migrate smoothly during interruptions. Companies like Lyft and Delivery Hero have cut costs by up to 75% using these strategies. For founders, tracking these metrics is essential to control costs and maintain performance.
4 Essential Spot Coverage Metrics for Cloud Cost Optimization
Spot Instances Explained: Save Up to 90% on Cloud Costs | Preemptible VMs Guide
sbb-itb-f9e5962
What Are Spot Instances?
Spot instances offer an opportunity to save significantly on cloud costs by using unused capacity at discounted rates. Think of it like airlines selling last-minute tickets for empty seats – they’d rather fill them at a lower price than leave them empty.
However, these savings come with a catch: spot instances can be interrupted. If the cloud provider needs the capacity back for On-Demand users, they’ll give you a two-minute warning before reclaiming the instance. Unlike On-Demand instances, which remain entirely under your control, spot instances are subject to termination by the provider. Additionally, while On-Demand pricing stays constant, spot prices fluctuate based on long-term trends in supply and demand.
Because of this inherent unpredictability, spot instances are ideal for workloads that can handle interruptions. They shine in use cases like batch processing, AI/ML training, containerized tasks, CI/CD pipelines, high-performance computing, and test environments. These types of applications are typically stateless and fault-tolerant, meaning they can pause and resume without major issues. On the other hand, stateful applications – such as production databases or real-time transactional systems – require uninterrupted uptime and aren’t a good fit for spot instances.
| Feature | Spot Instances | On-Demand Instances |
|---|---|---|
| Price | Dynamic (up to 90% discount) | Fixed, set by the provider |
| Availability | Depends on unused capacity; can be interrupted | Always available; user-controlled termination |
| Best Use Case | Flexible, fault-tolerant workloads | Critical, steady-state workloads |
To make the most of spot instances, tools like Spot Placement Scores (rated 1–10) can help you assess the likelihood of successfully securing a spot instance in a specific region. By leveraging these insights, you can maximize efficiency while minimizing disruption, aligning your workloads with the flexibility spot instances provide.
Core Spot Coverage Metrics to Track
Tracking the right metrics separates founders who actively manage cloud costs from those who leave savings to chance. Below are four key metrics that provide the insights needed to make informed decisions about your spot instance strategy.
Spot Instance Utilization Rate
This metric reflects the percentage of your total compute hours running on spot instances. To calculate it, use the formula: (spot hours used / total compute hours) × 100. For example, if you use 800 out of 1,000 hours on spot instances, your utilization rate is 80% – an excellent benchmark for workloads like CI/CD pipelines, batch processing, and containerized microservices.
You can monitor this in Amazon CloudWatch under the AWS/EC2Spot namespace by tracking indicators like FulfilledCapacity and TargetCapacity. To maintain high utilization, use the price-capacity-optimized allocation strategy in Auto Scaling groups. Enabling Capacity Rebalancing alerts you when an instance is at risk of interruption, giving you time to adjust before the two-minute notice. This metric helps you fine-tune workloads for maximum savings.
Spot Interruption Frequency
Spot Interruption Frequency tracks how often AWS reclaims your spot capacity. Historically, interruption rates across regions and instance types average below 5%. AWS categorizes these rates into ranges (e.g., less than 5%, 5–10%, etc.), so aiming for an interruption frequency under 5% helps maintain application performance.
Interruptions occur when AWS reclaims capacity for on-demand users.
"Spot Instance interruptions are an inherent part of the Spot Instance lifecycle." – Sudhi Bhat, Senior Specialist SA, Flexible Compute, AWS
To reduce interruptions, spread workloads across multiple zones and diverse instance types. Attribute-based instance selection allows your system to automatically choose instances that fit your CPU and memory needs, reducing reliance on specific types. Monitoring EC2 Instance Rebalance Recommendations can prompt proactive workload migration. Using older-generation instances can also improve availability since they face less on-demand competition [3, 13]. By keeping interruptions low, you ensure smoother performance.
For example, the NFL has used 4,000 spot instances across over 20 instance types since 2014, saving more than $20 million by embracing instance diversity [13, 4].
Spot Cost Savings Potential
This metric measures the cost difference between spot and on-demand instances. Use this formula: (on-demand cost – spot cost) / on-demand cost × 100. For instance, if on-demand usage costs $10,000 monthly but spot instances cost $2,000, you’re achieving 80% savings.
For more detailed insights, track:
- Cost per vCPU-hour: (spot total cost / total vCPU-hours)
- Cost per GiB-hour: (spot total cost / total memory GiB-hours)
| Cost Metric | Calculation | Purpose |
|---|---|---|
| Savings Percentage | (On-Demand Cost – Spot Cost) / On-Demand Cost × 100 | Overall discount compared to on-demand pricing |
| Cost per vCPU-hour | Spot Total Cost / Total vCPU-hours | Efficiency per processing unit |
| Cost per GiB-hour | Spot Total Cost / Total memory GiB-hours | Efficiency per memory unit |
Enable Spot Instance Data Feeds to receive hourly reports in an S3 bucket, providing granular data on market prices and charges. Additionally, Spot Placement Scores (rated from 1 to 10) can help identify regions and availability zones that meet your capacity needs at the best prices [9, 13]. This metric gives you a clear picture of your savings potential and helps optimize resource allocation.
Spot Coverage Ratio
Building on the earlier metrics, the Spot Coverage Ratio measures how much of your eligible workload is running on spot instances. If 70 out of 100 eligible workloads use spot instances, your coverage ratio is 70%, signaling room for improvement.
Aim for a coverage ratio above 70% to maximize cost efficiency. Audit your workloads to identify fault-tolerant applications – like development environments, data processing pipelines, containerized microservices, or machine learning training jobs – that can run on spot instances. Implement checkpointing to save progress and ensure applications can gracefully shut down within the two-minute notification window. Use CloudWatch metrics like AvailableInstancePoolsCount and EligibleInstancePoolCount to target the most cost-effective pools. This metric helps you expand the number of workloads benefiting from spot savings.
Tools and Methods for Tracking Spot Metrics
Real-Time Monitoring with Native Tools
Amazon CloudWatch processes raw data into clear, actionable metrics at default intervals of five minutes. For those needing more precision, enabling detailed monitoring reduces this to one-minute intervals, offering timely fleet-level metrics like FulfilledCapacity and AvailableInstancePoolsCount.
When interruptions occur, Amazon EventBridge is a powerful tool for triggering automated responses. For instance, when AWS sends a BidEvictedEvent or an interruption notice, EventBridge can activate Lambda functions or initiate other workflows almost instantly. In Kubernetes setups, the AWS Node Termination Handler (NTH) plays a critical role by monitoring the Instance Metadata Service (IMDS) for interruption notices. It automatically cordons and drains pods from affected nodes, ensuring workloads are safely migrated before the instance is reclaimed. This provides more granular node-level insights than what you’d get from CloudTrail logs.
Additionally, enabling the Spot Instance Data Feed lets you collect hourly usage and pricing data in an S3 bucket. Key fields like MarketPrice, Charge, UsageType, and MyMaxPrice help you audit costs over time. These real-time metrics lay the groundwork for implementing automated fault-tolerance strategies and scaling measures.
Automation for Fault Tolerance and Scaling
Automation can turn spot instance management into a proactive process rather than a reactive one. EC2 Capacity Rebalancing is a key feature here – it monitors rebalance recommendations, which serve as early warnings of potential interruptions. These recommendations occur up to seven times more often than actual interruptions, giving you enough time to migrate workloads effectively.
To ensure smooth scaling, configure your Spot Fleet with the maintain type and use CloudWatch alarms to trigger step scaling policies based on metrics like CPU usage or custom-defined thresholds. Opt for the price-capacity-optimized allocation strategy to focus on pools with higher availability and competitive pricing, which can significantly reduce the frequency of interruptions compared to the lowest-price strategy. For Capacity Rebalancing, using the launch-before-terminate setting ensures replacement instances are up and running before current ones are retired. Set your connection draining delay to 120 seconds for optimal performance. To further improve availability, ensure your fleet is flexible across at least 10 different instance types and spans all possible Availability Zones. Custom dashboards can then bring all these metrics together for a more comprehensive view.
Custom Dashboards for Data Visualization
Custom dashboards are the glue that ties real-time monitoring and automation together, offering a centralized view for efficient decision-making. These dashboards can display metrics like spot placement scores, which highlight the AWS Regions or Availability Zones with the best capacity and reliability for your needs. With AWS Lambda, you can update these scores every five minutes for the most current data. A good dashboard should also visualize the gap between TargetCapacity and FulfilledCapacity, helping you quickly identify when your fleet is under strain. Monitoring TerminatingCapacity provides insight into how often rebalancing actions occur.
Use filters such as AvailabilityZone, InstanceType, and FleetRequestId to focus on specific pools that are more prone to interruptions. For T-series instances, include the CPUCreditBalance metric to ensure performance isn’t throttled during high-demand periods. You can also integrate data from your Spot Instance Data Feed to compare MarketPrice against MyMaxPrice, giving you a clear picture of your cost savings and actual charges per instance hour. If needed, third-party observability tools can bring in Kubernetes events and CloudWatch metrics, helping you correlate interruptions with specific instance types or availability zones.
How TechVZero Optimizes Cloud Spending
TechVZero has crafted a solution that helps SaaS and AI founders slash cloud costs by 40–60%, leveraging bare-metal Kubernetes. A key focus of their approach is tackling outbound transfer (egress) costs, a major expense that eats into SaaS margins. By combining the scalability and reliability of Kubernetes with the affordability of bare-metal servers, they deliver enterprise-level performance without the hefty price tag. This aligns with the resource efficiency and cost predictability metrics discussed earlier.
Their pricing model is refreshingly simple: TechVZero takes 25% of the savings achieved over a year, and if no savings threshold is met, there’s no fee. One standout example? They helped a client save $333,000 in just one month.
Beyond infrastructure optimization, TechVZero introduces a "scale-to-zero" policy for development environments, cutting out idle resource costs entirely. They also fine-tune resource usage by right-sizing pods and implementing proven scaling strategies. For those curious about potential savings, TechVZero provides a free Cloud to Bare Metal Cost Calculator. This tool helps founders map their workload needs to potential cost reductions.
This hybrid cloud approach takes inspiration from large-scale platform strategies but is tailored for smaller teams (10–50 people) that need enterprise-level efficiency without the burden of hiring in-house experts. By combining these cost-saving strategies with precise spot coverage monitoring, founders can significantly improve their cloud spending efficiency.
Conclusion
Spot coverage metrics are a game-changer when it comes to managing cloud costs. The four main metrics – utilization rate, interruption frequency, cost savings potential, and coverage ratio – offer the insights needed to decide how and where to run workloads effectively. These metrics have proven their value, as demonstrated by the NFL’s ability to significantly reduce costs through careful monitoring.
One key insight? Flexibility is the cornerstone of success. Diversifying instance types leads to better placement scores, as highlighted by Steve Cole from AWS. Founders who spread workloads across at least 10 instance types, track placement scores in real time, and adopt automated allocation strategies can cut costs substantially without compromising performance.
Real-time monitoring is non-negotiable because spot capacity is constantly shifting. Keeping an eye on metrics like the two-minute interruption notice and rebalance recommendations ensures you’re prepared for changes.
Companies like TechVZero illustrate how these principles can be put into action. By using bare-metal Kubernetes and a performance-based pricing model tied to annual savings, they deliver 40–60% cost reductions. This shows how tracking the right metrics and working with infrastructure specialists can bring enterprise-level efficiency without requiring an in-house team.
To succeed, focus on these principles: monitor thoroughly, diversify your approach, and automate wherever possible. Founders who embrace these strategies will maximize their cloud savings and performance.
FAQs
Which workloads should never run on Spot?
Spot instances are not ideal for workloads that are stateless, fault-tolerant, and flexible. Examples include big data processing, containerized workloads, CI/CD pipelines, stateless web servers, high-performance computing (HPC), and rendering tasks. These types of workloads are susceptible to interruptions and need to maintain resilience to deliver consistent performance.
How do I set a safe Spot diversification plan?
To build a reliable Spot diversification plan, aim to reduce interruptions while keeping costs low. Start by spreading your workload across different instance types and Availability Zones to lower the risk of disruptions. Leverage automation tools like Kubernetes Pod Disruption Budgets and autoscaling features to manage potential interruptions effectively. Keep an eye on Spot placement scores and real-time capacity data to fine-tune your choices of regions and instance types. By combining these tactics, you can create a robust and economical strategy for using Spot instances.
What should I automate during a Spot interruption?
To handle Spot interruptions effectively and keep disruptions to a minimum, consider automating key actions. Here are some strategies:
- Graceful shutdown or hibernation: Save the current state or complete critical tasks before the instance is interrupted.
- Trigger workflows with interruption notices: Use these notices to save progress or safely detach resources.
- Rebalance or replace instances proactively: This helps maintain the continuity of your workload.
- Checkpoint and back up data: Store data in persistent storage to avoid any loss during interruptions.
By implementing these steps, you can build resilience into your processes and keep operations running smoothly.