GPU Resource Allocation for SLA Compliance

Static GPU allocation is inefficient and risks SLA violations. To ensure smooth AI operations, dynamic GPU allocation is the key to balancing performance and cost. Here’s why this matters:
- Underutilization is expensive: GPU clusters often operate at only 15–25% utilization, wasting resources and money.
- SLAs demand precision: Metrics like Time to First Token (TTFT) and Inter-Token Latency (ITL) are critical for user experience. Delays can lead to contractual breaches and financial losses.
- Static allocation fails under pressure: Fixed GPU assignments lead to resource starvation, fragmentation, and long wait times during traffic surges.
- Dynamic strategies solve these problems: Profiling workloads, prioritizing tasks, and using AI-driven schedulers improve efficiency and reduce costs.
Dynamic GPU allocation isn’t just about better performance – it’s about cutting costs while meeting SLA requirements. The right tools and strategies, like NVIDIA DCGM, AI Configurator, and workload tiering, can help you optimize resources effectively.
Profiling and Understanding GPU Workloads
GPU Workload Categories: Resource Allocation Strategies and SLA Metrics
When it comes to effective GPU resource allocation, the first step is understanding your workloads. Profiling helps identify which tasks are actively using resources and which are idling. On average, GPU-enabled Kubernetes clusters only hit 15-25% utilization. That means a lot of organizations are paying for unused capacity. Profiling isn’t just a nice-to-have; it’s essential for prioritizing tasks based on their importance to the business.
Categorizing Workloads by Business Impact
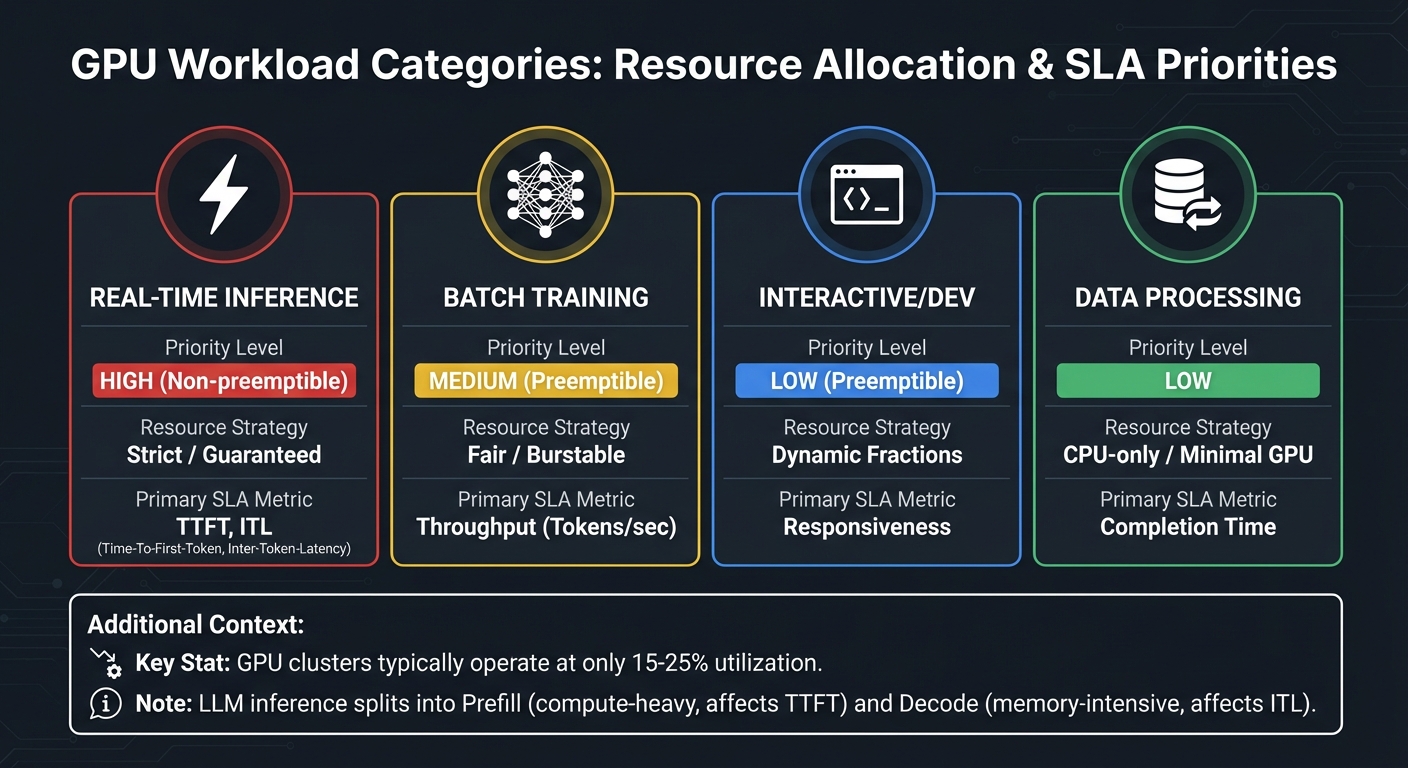
Different workloads demand different strategies. Here’s how they break down:
- Real-time inference powers customer-facing apps and requires strict guarantees. These workloads are non-preemptible, meaning they receive "Strict" allocation, where GPU compute limits match the requested fraction.
- Batch training jobs, on the other hand, can handle interruptions. They usually operate under a "Fair" allocation model, ensuring a baseline while allowing them to tap into unused capacity when available.
- Interactive development sessions, like Jupyter notebooks, show sporadic GPU usage – idle during code reviews but spiking during tests. These sessions benefit from dynamic GPU fractions that allow bursts of activity without risking eviction.
- LLM inference can be split into two phases: prefill, which is compute-heavy and affects Time to First Token (TTFT), and decode, which is memory-intensive and impacts Inter-Token Latency (ITL). Profiling these phases separately lets you scale resources based on which SLA metric is at risk.
Here’s a quick overview of these workload types:
| Workload Category | Priority Level | Resource Strategy | Primary SLA Metric |
|---|---|---|---|
| Real-time Inference | High (Non-preemptible) | Strict / Guaranteed | TTFT, ITL |
| Batch Training | Medium (Preemptible) | Fair / Burstable | Throughput (Tokens/sec) |
| Interactive/Dev | Low (Preemptible) | Dynamic Fractions | Responsiveness |
| Data Processing | Low | CPU-only / Minimal GPU | Completion Time |
Baseline Performance Metrics for GPUs
To keep your GPUs running efficiently, you need to monitor the right metrics:
- GPU Compute Utilization (
DCGM_FI_DEV_GPU_UTIL) measures how often your GPU is actively working. It’s a key indicator of health. - GPU Memory Usage (
DCGM_FI_DEV_FB_USED) can reveal inefficiencies. High memory usage with low compute often points to idle or over-replicated models. - SLA compliance depends on metrics like Time to First Token (TTFT), Inter-Token Latency (ITL), and End-to-End Request Latency, all of which directly affect user experience.
- Streaming Multiprocessor (SM) Activity reveals how well your GPU’s processors are utilized. Low SM activity with high GPU utilization often signals parallelization issues.
- Tensor Core Activity (
DCGM_FI_PROF_PIPE_TENSOR_ACTIVE) shows whether workloads are using hardware acceleration for matrix operations, which is critical for AI/ML tasks. - For distributed training, NVLink bandwidth helps identify bottlenecks in GPU-to-GPU communication.
A real-world example? In November 2025, NVIDIA cut GPU waste from 5.5% to just 1% in their research clusters. Sachin Lakharia and Vikas Mehta led the effort by integrating DCGM telemetry with Slurm job metadata. They introduced an "Idle GPU job reaper" that terminated inactive jobs after an hour.
"Small inefficiencies compound quickly at scale. Once the right metrics were exposed, visibility alone drove a natural shift toward accountability and better behavior across teams." – Sachin Lakharia, Principal Software Engineer, NVIDIA
Tools for Profiling GPU Workloads
Several tools can help you profile and optimize GPU workloads:
- NVIDIA Data Center GPU Manager (DCGM) and dcgm-exporter are go-to solutions for real-time telemetry in Kubernetes environments. These tools provide metrics like SM occupancy, Tensor Core usage, and memory stats, which can be visualized in Prometheus and Grafana. Collecting metrics at 1-second intervals ensures you capture transient spikes that longer averages might miss.
- NVIDIA Dynamo simplifies SLA profiling with DynamoGraphDeploymentRequests (DGDR). You can set performance targets (e.g., TTFT < 200ms), and the operator handles resource discovery and profiling. While profiling live engines takes hours, AI Configurator (AIC) can simulate results in just 20-30 seconds without deploying GPUs.
- Deep Learning Profiler (DLProf) works across frameworks and uses NVTX markers to link GPU and CPU time to specific model operations. For PyTorch, enabling
nvidia_dlprof_pytorch_nvtxand using theemit_nvtx()context manager ensures GPU kernels are tied to model layers. This helps pinpoint Tensor Core opportunities and bottlenecks.
Dynamic GPU Allocation Strategies for SLA Compliance
After profiling your workloads, the next logical step is to implement allocation strategies that can adapt to actual demand. Static assignments often result in inefficient GPU usage, with utilization hovering around 50%. Dynamic allocation addresses this issue by aligning resources with real-time needs, making it a critical approach for meeting SLA requirements.
Designing Allocation Policies Based on SLAs
Crafting effective allocation policies starts with tiered resource management. This involves separating guaranteed resources from burstable capacity. For instance, you can assign a baseline "Request" to ensure a minimum level of resources is always available, while setting a higher "Limit" for workloads that need to burst when additional capacity is available. This setup allows idle GPU memory to be temporarily lent to lower-priority tasks, ensuring efficient usage without compromising high-priority needs.
For large language models (LLMs), it’s essential to manage scaling separately for prefill workers (which are compute-intensive and influence TTFT) and decode workers (which are memory-bound and affect ITL). This separation ensures you’re not over-allocating resources to one component just to meet the SLA demands of another.
Tools like DynamoGraphDeploymentRequests (DGDR) simplify this process. They let you set performance targets – such as keeping TTFT under 200ms – while dynamically adjusting tensor parallelism and replica counts to meet those goals. With AI Configurator, you can identify optimized configurations in as little as 20–30 seconds, compared to the hours it typically takes with live-engine testing.
Implementing AI-Driven Dynamic Allocation
Building on tiered policies, AI-driven strategies take things further by using predictive models to forecast demand. Techniques like ARIMA and Prophet analyze historical data to predict future request volumes and sequence lengths. By anticipating spikes in demand, these methods allow you to adjust capacity proactively, avoiding SLA violations.
Performance interpolation is another key tool. By leveraging pre-deployment profiling data, it estimates how metrics like TTFT and ITL will change under various loads. Schedulers can then determine the optimal number of replicas needed to maintain SLA compliance. Real-time correction factors adjust for variables like cache performance or network jitter, ensuring accuracy.
Multi-objective schedulers are particularly valuable for balancing competing priorities. The Hybrid Priority Scheduler (HPS), for example, uses a scoring system that takes efficiency, fairness (via aging mechanisms), and fragmentation reduction into account. Simulations show HPS achieving 78.2% GPU utilization while processing 25.8 jobs per hour. Similarly, the RLTune framework leverages reinforcement learning to cut queueing delays by up to 81% and reduce job completion times by as much as 70%.
"The emergence of LLMs has fundamentally changed GPU resource demand patterns, creating an urgent need for more efficient management strategies." – GFS Research Team
Balancing Multi-Tenancy and Resource Isolation
In multi-tenant environments, maintaining SLA compliance requires a careful balance between resource isolation and flexible scheduling. NVIDIA Multi-Instance GPU (MIG) stands out as a hardware-level solution for memory and fault isolation, making it ideal for production environments with strict SLA requirements. On the other hand, time-slicing allows for higher oversubscription by interleaving workloads, though it lacks the memory and fault isolation provided by MIG. For predictable performance, MIG is the better choice, while time-slicing works well for bursty, non-critical tasks.
To preserve quality of service (QoS) in shared environments, deploying a GPU OOMKiller can be a game-changer. This tool terminates burstable processes that have borrowed resources when those resources are needed by workloads with guaranteed allocations. This approach prevents "noisy neighbor" issues while maximizing utilization during idle periods.
Another strategy is to implement aging thresholds to ensure fairness. For example, large training jobs often get stuck behind smaller, constant inference requests. By increasing the priority of jobs that have waited beyond a set threshold – say, five minutes – you can prevent starvation without compromising overall efficiency.
Monitoring and Automation for Sustained SLA Compliance
To ensure SLA compliance over time, real-time monitoring and automated remediation are essential. While dynamic allocation strategies help optimize resources, these processes require constant oversight and quick responses to maintain performance standards.
Real-Time GPU Performance Monitoring
When it comes to GPU monitoring in production clusters, NVIDIA Data Center GPU Manager (DCGM) has become the go-to solution. A typical setup includes a collector like dcgm-exporter, a time-series database such as Prometheus or AWS CloudWatch, and a visualization tool like Grafana or Google Cloud Monitoring.
In Kubernetes clusters, dcgm-exporter integrates with the kubelet pod-resources server to map GPUs to specific pods. This mapping is critical for pinpointing performance issues tied to specific applications or teams, which plays a big role in SLA tracking. If you’re using Google Kubernetes Engine (GKE) version 1.32.1-gke.1357000 or newer, DCGM metrics are enabled by default for new clusters.
To keep SLAs intact, focus on metrics that matter. GPU utilization stats – such as GPU, memory, and SM occupancy – can highlight bottlenecks. Performance indicators like clock speeds and temperature can reveal issues like thermal throttling, while interconnect metrics (NVLink and PCIe bandwidth) ensure data transfer speeds are up to par.
AWS CloudWatch provides detailed GPU metrics, making precise SLA monitoring possible. Tools like Prometheus Alertmanager or CloudWatch Alarms can trigger automated workflows when GPU utilization crosses critical thresholds (e.g., 90%) or when error rates surge. For testing, dcgmproftester ensures your system accurately captures peaks in utilization and power draw.
"Trends in GPU metrics correlate with workload behavior and make it possible to optimize resource allocation, diagnose anomalies, and increase overall data center efficiency." – NVIDIA
These insights allow for automated corrective actions, helping to quickly address potential SLA violations.
Automated Remediation for SLA Violations
Monitoring is just one piece of the puzzle. To maintain SLA compliance, you also need automated systems that can step in when issues arise. For instance, idle job reapers help free up GPUs by terminating inactive jobs.
The GPUOOMKiller is another tool that ensures Quality of Service by reclaiming burstable memory when primary workloads demand extra capacity. Kubernetes PriorityClasses can also prioritize critical jobs, preempting lower-priority tasks during resource contention. Additionally, Horizontal Pod Autoscalers, configured with custom GPU metrics like dcgm_gpu_utilization or inference latency, can scale resources before SLA thresholds are breached. While most machine learning workloads see GPU utilization below 30%, effective automation can reduce cloud GPU expenses by as much as 40%.
Beyond real-time adjustments, proactive measures are crucial to maintaining SLA performance.
Predictive Maintenance and Failure Mitigation
Hardware failures are unavoidable at scale, so catching issues early is critical. For new GPU deployments, running 72–168-hour burn-in tests helps identify potential failures (often called "infant mortality") before they impact production SLAs. Regular DCGM diagnostics can flag GPUs with performance degradation of 15% or more, allowing for timely decommissioning.
Temperature management is another key factor. HBM error rates double for every 5°C above 75°C. DCGM Level 3 diagnostics, which take about 12 minutes, can assess memory bandwidth, PCIe throughput, NVLink, and thermal health. For large-scale operations involving 50,000 GPUs, downtime costs can reach $1.2 million per hour, making predictive maintenance a non-negotiable priority.
To minimize downtime, strategies like N+1 redundancy and "fail-in-place" mechanisms can automatically shift workloads to spare nodes. AWS, for instance, reports a mean time to repair (MTTR) of 12 minutes for failed H100 nodes, emphasizing the importance of redundancy for achieving five-nines SLA reliability. Keeping a 5% over-provisioning buffer can also cut job denial events by about 40%.
A cautionary tale comes from December 2025, when an AI cluster at Meta experienced a catastrophic failure just 72 hours after deployment. Synchronized training jobs caused thermal runaway across 2,000 H100 GPUs, resulting in $28 million in hardware damage. The root cause? Pre-production stress tests ran for only 4 hours at 60% load, failing to detect thermal buildup. This incident highlights the necessity of extended validation and continuous monitoring to ensure SLA compliance over time.
sbb-itb-f9e5962
Cost Optimization Without Compromising SLAs
Managing GPU expenses while meeting SLAs is no small feat. Even with solid monitoring practices, GPU costs can spiral due to their hefty price – 10 to 50 times higher than standard compute – and typical Kubernetes utilization rates of just 15–25%. For example, a 50-GPU cluster running at only 20% efficiency could waste over $200,000 annually. The challenge lies in cutting these costs without risking SLA violations.
Optimizing GPU Utilization
A significant portion of GPU waste stems from high memory usage hiding low compute activity. For instance, a model might consume 60GB of VRAM while sitting idle, waiting for requests, leading to unnecessary costs. Given the steep premium on GPU infrastructure, this inefficiency can burn through tens or even hundreds of thousands of dollars.
One solution is GPU sharing. Time-slicing allows multiple pods to share a single GPU, which is particularly effective for bursty inference workloads that don’t require strict isolation. Additionally, MIG (Multi-Instance GPU) provides isolated environments for high-priority production workloads.
Another approach is using dynamic GPU fractions. Tools like NVIDIA Run:ai let you allocate a "guaranteed" memory fraction while allowing a higher "limit" for burst capacity. This is ideal for development tasks, such as Jupyter notebooks, which can tolerate occasional memory reclamation.
For workloads with predictable traffic, time-based autoscaling can significantly cut costs. For example, scaling down inference replicas during off-peak hours (6 PM–8 AM) can reduce overnight GPU expenses by 58%. Event-driven workloads can go a step further by scaling to zero during idle periods, eliminating costs entirely.
Right-Sizing GPU Resources
Once utilization is optimized, the next step is matching GPU resources to the workload. Using a high-end GPU like the H100 (141GB VRAM) for a model requiring only 58GB wastes 59% of its capacity and costs 50–60% more than using an A100-80GB. To avoid this, profile peak memory usage over 7–14 days, add a 20% buffer, and choose the right GPU SKU.
Not all workloads require GPUs. Smaller models (under 1 billion parameters) can often run more cost-effectively on CPUs or AWS Graviton instances. For instance, in August 2025, Cinnamon AI, a document analysis startup, cut training costs by 70% and increased daily training jobs by 40% by using Amazon SageMaker Managed Spot Training.
To avoid capacity issues during scaling, diversify instance types. Mixing G and P series instances across generations and availability zones can prevent Insufficient Capacity Errors. For massive models (over 100 billion parameters), purpose-built accelerators like AWS Trainium can lower training costs by up to 50% compared to standard GPUs.
Checkpointing is critical for training jobs. Without it, Spot instance interruptions can force a complete restart, inflating costs by over 80%. Saving model weights and optimizer states to S3 ensures jobs can resume seamlessly after interruptions.
Using Spot Instances and Reserved Capacity
Selecting the right instance types can further reduce costs. Spot instances offer discounts of up to 90%, but they come with the risk of being reclaimed with just two minutes’ notice. While unsuitable for real-time inference, they’re perfect for fault-tolerant batch processing and training jobs with checkpointing enabled. For example, the NFL has saved over $20 million since 2014 by using Spot instances to build season schedules. Diversifying across at least 10 GPU instance types and all available availability zones increases the likelihood of acquiring Spot capacity. Using a price-capacity optimized allocation strategy ensures access to the most cost-effective pools.
For steady-state production workloads, Reserved Instances or Savings Plans offer discounts for 1- or 3-year commitments. Capacity Blocks for ML provide short-term reservations (1–14 days) for intensive training jobs without a long-term commitment. On-Demand Capacity Reservations guarantee availability in specific zones for critical tasks but come with full On-Demand rates.
| Strategy | Cost Savings | Availability | Best Use Case |
|---|---|---|---|
| Spot Instances | Up to 90% | No guarantee; subject to interruption | Fault-tolerant training, batch jobs |
| Reserved Capacity | Commitment-based | Guaranteed for term | 24/7 production inference |
| Capacity Blocks | Variable | Guaranteed during reservation | Short-term intensive training |
| On-Demand | None | Pay-per-use | Mission-critical, unpredictable workloads |
To maximize cost efficiency, tier your workloads. Use Reserved or On-Demand capacity for mission-critical real-time inference (Tier 1), Spot instances for batch processing (Tier 2), and shared queues for experimental tasks (Tier 3). Careful resource allocation and instance selection are critical for balancing performance with cost savings.
Conclusion
Dynamic GPU allocation isn’t just a technical upgrade; it’s a smart financial move. With GPU-enabled clusters operating at only 15–25% utilization, the cost of idle resources adds up fast – think over $200,000 annually for a 50-GPU cluster. Static allocation not only wastes money but also increases the risk of SLA violations. To address this, focus on strategies like automated profiling, metric-based autoscaling (using queue size), and workload tiering based on business priorities.
The financial benefits are hard to ignore. IBM Turbonomic found that automated resource management can deliver up to 247% ROI. Hyland Software saved 15% on computing costs across its data centers with over 2,000 automated resource adjustments. Meanwhile, the IBM CIO Office reduced cumulative memory limits by 3.8 TB through 45,000 automated actions each month. These aren’t hypothetical scenarios – they’re real-world results from companies that shifted from manual to AI-driven resource allocation.
"GPU-accelerated computing has become the dominant line item in cloud expenditure." – Santosh Pashikanti, Lead Cloud Architect
These proven outcomes make a compelling case for adopting dynamic allocation. Start by enhancing observability: install NVIDIA DCGM-Exporter to monitor metrics like power draw and SM activity, which offer a clearer picture of hardware usage beyond memory occupancy. Transition from whole-GPU device plugins to Dynamic Resource Allocation (DRA), letting pods request specific attributes like 16GB of VRAM instead of an entire GPU. Use AI Configurator simulations to cut down profiling time and refine your allocation strategy. Finally, integrate checkpoint/restore functionality to safely leverage spot instances and minimize cost risks.
Dynamic GPU allocation isn’t just about better performance – it’s about making every dollar and resource count.
FAQs
How does dynamic GPU allocation enhance SLA compliance compared to static allocation?
Dynamic GPU allocation fine-tunes memory and compute resources on the fly, matching the precise needs of each workload. This real-time adjustment helps cut down on resource waste, shortens job queues, and lowers latency. The result? GPU utilization often hits an impressive 78%, compared to the 45–67% range seen with static policies.
This method doesn’t just boost efficiency – it also ensures fairness. By dynamically distributing resources, critical workloads get the priority they need, avoiding job starvation. Plus, it keeps service-level agreements (SLAs) for response time and availability on track, all while keeping costs in check. Compared to static allocation, it’s a much smarter way to balance performance and budget.
What are the best tools for profiling and optimizing GPU workloads to meet SLA requirements?
To fine-tune GPU workloads while sticking to SLA requirements, several tools can help you monitor usage and improve performance. NVIDIA’s Dynamo simplifies the process with an SLA-focused profiling workflow. It automatically tracks GPU usage and provides configuration suggestions to meet specific latency or throughput targets. For those working with TensorFlow, the TensorFlow Profiler delivers detailed insights into operation timing, memory usage, and GPU activity, making it easier to pinpoint bottlenecks and enhance model performance.
On the infrastructure side, tools like nvidia-smi are invaluable for tracking GPU utilization, power consumption, and tensor-core activity. This ensures that resources are allocated effectively – neither overused nor wasted. For more dynamic resource management, platforms such as Run:AI allow real-time adjustments like fractional GPU allocation and time-slicing. These features help turn profiling data into immediate cost savings while maintaining SLA commitments.
By leveraging these tools together, you can systematically optimize GPU performance, control expenses, and ensure your resources are aligned with service-level agreements.
Why is tracking GPU performance metrics critical for meeting SLA requirements?
Keeping an eye on GPU performance metrics is key to meeting SLA requirements. It helps pinpoint problems like underutilization, latency, or power inefficiencies – factors that can interfere with guarantees for latency and throughput outlined in your SLA.
Monitoring these metrics allows for real-time adjustments, such as scaling resources or tweaking configurations, to ensure your services remain reliable without overspending. Staying proactive with monitoring keeps your systems efficient, responsive, and aligned with your SLA obligations.