Reducing Tool Sprawl in DevOps Monitoring
Tool sprawl in DevOps monitoring creates inefficiencies and costs by using too many disconnected tools for metrics, logs, traces, and alerts. This leads to data silos, slower incident responses, higher costs, and overwhelmed teams. Here’s the bottom line:
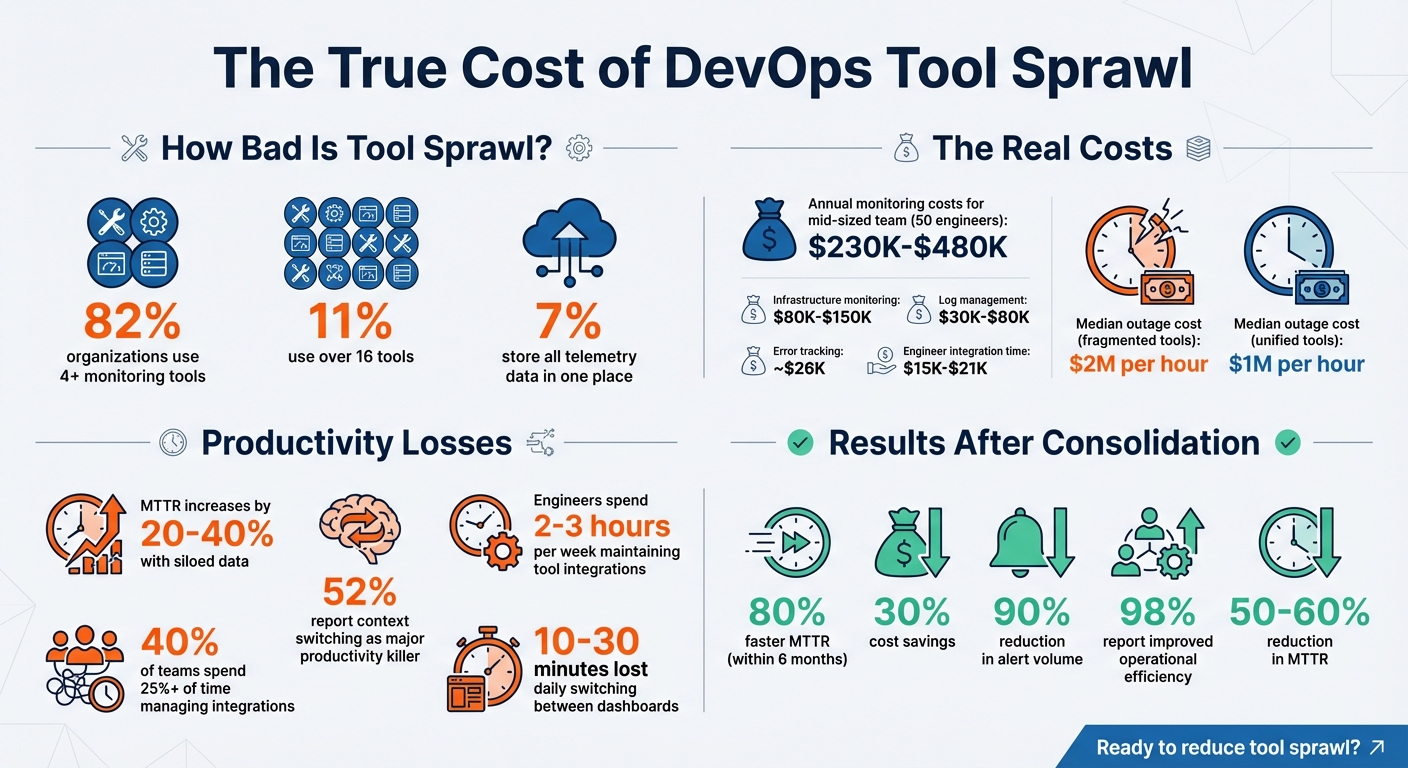
- 82% of organizations use 4+ tools, and 11% use over 16.
- Siloed data increases Mean Time to Recovery (MTTR) by 20–40%, with outages costing up to $2M per hour.
- Managing fragmented tools can cost $230K–$480K annually for a mid-sized team.
The solution? Consolidate tools into unified platforms that integrate metrics, logs, and traces. This reduces costs, simplifies workflows, and improves incident response times. For example, teams adopting centralized observability reported 80% faster MTTR and up to 30% cost savings.
To reduce tool sprawl:
- Audit your tools: Identify overlaps and prioritize essential ones.
- Adopt open standards: Use frameworks like OpenTelemetry for flexibility.
- Centralize data: Combine metrics, logs, and traces into a single platform.
- Measure results: Track MTTR, tool count, and alert quality post-consolidation.
Reducing tool sprawl improves efficiency, lowers costs, and helps teams focus on solving problems instead of managing tools.
The True Cost of DevOps Tool Sprawl: Key Statistics and Impact
The Real Costs of Tool Sprawl
Money Spent on Licenses and Maintenance
The financial burden of managing a scattered monitoring stack adds up fast. For a mid-market team of 50 engineers, annual expenses on monitoring tools can range from $230,000 to $480,000. Here’s how those costs typically break down:
- Infrastructure monitoring: $80,000–$150,000
- Log management: $30,000–$80,000
- Error tracking: Around $26,000
- Incident management: $15,000–$21,000
- Senior engineer time for integrations: $15,000–$25,000
If your systems demand high availability and disaster recovery across multiple disconnected tools, costs can double. Each tool requires its own storage, database access, and virtualization setup. On top of that, managing separate vendor contracts eats up administrative time with repeated procurement reviews and negotiations. For new hires, onboarding becomes a slower process, taking an extra 2–4 weeks to learn the ins and outs of different tools – from query languages to dashboards and alert systems.
"For most teams? You’re paying a quarter million dollars a year for the privilege of alt-tabbing during outages. That’s the $500K mistake." – Jamie Mallers, GTM and Growth, OneUptime
These rising costs don’t just hit your wallet – they also hurt your ability to respond to incidents effectively.
Siloed Data Slows Down Incident Response
When metrics, logs, and traces are scattered across multiple tools, engineers spend more time piecing data together than fixing the actual problem. This manual correlation process can increase mean time to recovery (MTTR) by 20–40%. The financial impact is staggering: the median cost of a high-impact outage reaches $2 million per hour for teams without unified visibility, compared to $1 million per hour for those using consolidated observability tools.
Despite the clear benefits of unified data, only 7% of organizations store all their telemetry data in one place. This forces teams to lean heavily on senior engineers to manually connect the dots during critical incidents. The problem? If that key person is unavailable, the entire response effort can grind to a halt. By centralizing tools and data, these inefficiencies – and the associated costs – can be significantly reduced.
How Multiple Tools Overwhelm Teams
Beyond slowing response times, tool sprawl puts a heavy strain on engineering teams. Nearly 40% of teams report spending over 25% of their time managing integrations. That’s a huge chunk of capacity lost to maintenance instead of building new features or solving core problems. On average, engineers dedicate 2–3 hours per week per person to maintaining glue code, webhooks, and API connections across fragmented tools.
And it doesn’t stop there. 52% of engineering teams say that constant context switching is a major productivity killer. Juggling multiple tools leads to redundant alerts, which can overwhelm teams and cause alert fatigue. When fatigue sets in, critical warnings may get overlooked, reducing the overall effectiveness of incident detection. Consolidating tools into a single platform can help alleviate this burden and restore focus to what matters most.
sbb-itb-f9e5962
How to Reduce Tool Sprawl
Use Unified Observability Platforms
Bringing metrics, logs, and traces together in one platform can dramatically cut down on tool sprawl. Instead of jumping between multiple screens during incidents, teams can rely on a single source of truth, speeding up root cause analysis. For example, a software company reported an 80% improvement in MTTR within just six months of centralizing their observability efforts.
Unified platforms also simplify data handling by using standardized schemas like Elastic Common Schema. This consistency allows users to shift between different types of telemetry without needing to learn multiple query languages. The result? Faster onboarding. New team members can quickly become effective when they only need to learn one tool instead of juggling several. In fact, 98% of organizations that adopted centralized observability noted better operational efficiency.
"Centralized observability saves other teams from having to build their own monitoring infrastructure." – Financial services organization representative
Automate Alert Prioritization with AI
Once you’ve centralized your data, AI-powered alerting can take things a step further. These systems cut through the noise by correlating fragmented data and consolidating multiple alerts into a single, actionable incident. This means teams no longer have to piece together clues from countless dashboards during outages.
Take InterContinental Hotels Group (IHG) as an example. In 2023, they implemented BigPanda’s AIOps platform to unify their fragmented observability stack. By leveraging AI, they gained better visibility into their systems, reduced IT complexity, and lowered operational costs. The platform also helped identify which tools delivered useful alerts and which ones were just adding noise, making it easier to phase out unnecessary systems.
Standardize Your Monitoring Stack
Standardizing your monitoring tools is another effective way to tackle tool sprawl. Start by adopting open standards like OpenTelemetry, which has become the go-to framework for observability data. OpenTelemetry allows teams to switch backend tools without reworking instrumentation, reducing vendor lock-in and making consolidation far smoother.
Focus on addressing your most pressing challenges first, whether that’s manual status updates, data duplication, or maintaining custom integrations. Look for platforms that offer API-first integration and pricing models based on resources rather than per-agent fees. To ensure a smooth transition, run your new consolidated solutions alongside legacy systems to catch any edge cases before fully retiring older tools. Standardizing your stack not only simplifies integration but also reduces the overall complexity of your monitoring ecosystem.
Steps to Reduce Tool Sprawl
Step 1: Audit Your Current Tools
Start by creating a detailed inventory of every monitoring tool in your environment. For each tool, note its name, version, owner, and purpose – whether it handles APM, logs, traces, or metrics. Many organizations overlook unofficial or "shadow IT" tools, so dig deep. Check procurement records, alert sender domains, and active host agents to uncover hidden tools.
Once you’ve compiled your list, align each tool with the four pillars of observability: Metrics, Events, Logs, and Traces (MELT). This step helps identify overlapping capabilities and unnecessary expenses. To dig deeper, trace a typical workflow – like resolving a bug – through your toolchain. This will highlight areas of inefficiency, such as manual steps or duplicated data.
"Tool sprawl isn’t really about the tools. It’s about how solutions evolve organically in response to immediate needs without anyone taking a step back to look at the bigger picture." – Jose Mendoza Gomez
Next, evaluate each tool using a scorecard. Rate them on a scale from 0 to 10 based on criteria like functionality, technical fit, security compliance, and scalability. Then, categorize tools by business importance: High (mission-critical), Medium (helpful but not essential), or Low (nice-to-have). This ranking will clarify which tools to retain and which to phase out. Coordinate these changes with contract renewal dates to ensure a smooth transition.
With a prioritized inventory in hand, you’re ready to start consolidating your telemetry data.
Step 2: Integrate Metrics, Logs, and Traces
Streamline your telemetry by adopting a unified standard like OpenTelemetry. This open framework avoids vendor lock-in and makes it easier to switch backend tools without reworking your instrumentation. To ensure consistency, use a common schema such as the Elastic Common Schema (ECS) for normalizing metadata. This approach enables your team to move seamlessly between metrics, logs, and traces without having to learn multiple query languages.
Automate data flows with API-first integration, creating a centralized view of your telemetry. For example, if monitoring alerts don’t automatically trigger incident management workflows, fix those friction points first. Consolidate your tools gradually, focusing on one area at a time. This phased approach minimizes risk and delivers quick wins to maintain momentum.
The goal is a single pane of glass – a unified dashboard where all telemetry data is accessible. This eliminates the need to jump between multiple screens during incident resolution. Advanced platforms that use machine learning to correlate anomalies (e.g., linking error log spikes to specific traces) can significantly speed up root cause analysis. If this seems like a daunting task, keep in mind that only 7% of organizations have fully unified telemetry data, so you’re not alone.
Step 3: Track Results After Consolidation
After consolidating your tools, measure the impact to validate your efforts. Start by establishing a baseline for metrics like Mean Time to Resolution (MTTR) and tool count over a 30-day period. Break MTTR into phases – Detect, Acknowledge, Assemble, Diagnose, and Resolve – to pinpoint where consolidation has the biggest effect.
Also, track the coordination tax – the time spent on tasks like setting up Slack channels, finding on-call engineers, or locating runbooks. This overhead can account for up to 25% of total MTTR. Post-consolidation, measure how much time you’ve saved in each phase. Organizations with unified workflows have reported up to 80% reductions in MTTR within 90 days. Additionally, monitor alert quality by tracking the number of alerts and the ratio of high-signal alerts to false positives. Automated alert routing can cut alert volume by 90% or more, reducing noise significantly.
To quantify improvement, use this formula:
% Reduction = ((Baseline MTTR - Current MTTR) / Baseline MTTR) × 100.
Beyond MTTR, evaluate licensing costs and the size of your tool stack. For a team of 100 engineers, saving just 25 minutes per incident (across 15 incidents per month) equals approximately 31.25 engineering hours saved monthly – potentially offsetting platform costs within a single month.
| Metric | Before Consolidation | After Consolidation | Target Improvement |
|---|---|---|---|
| Number of Tools | 6-20+ tools | 1-3 unified platforms | 50-80% reduction |
| MTTR | 1 day to 1 week | Under 1 hour | 60-80% reduction |
| Alert Volume | High noise, low signal | 90% fewer alerts | 85-90% reduction |
| Coordination Time | 25-40 min per incident | 5-10 min per incident | 70-80% reduction |
| Post-Mortem Completion | 40% completion rate | 85%+ completion rate | 100%+ improvement |
Conclusion: What You Gain from Fewer Tools
Main Benefits of Reducing Tool Sprawl
Cutting down on tool sprawl can lead to immediate and noticeable savings. For instance, one global enterprise managed to slash its observability costs by 30% simply by removing redundant platforms. Beyond licensing fees, consolidation also reduces hidden costs like maintenance, storage, and labor. In fragmented systems, observability expenses can spiral out of control – sometimes even exceeding the growth of system traffic. Shockingly, a single custom metric can cost up to $30,000 per month.
Operational efficiency gets a major boost, too. Engineers often lose 10 to 30 minutes every day just switching between different monitoring dashboards. By adopting a unified system, some teams have managed to cut Mean Time to Resolution (MTTR) by 50–60%. This is because a streamlined setup allows them to transition smoothly from identifying symptoms to pinpointing root causes without the hassle of manually correlating data across multiple platforms.
"Unified observability isn’t about having fewer tools for the sake of simplicity. It’s about creating a coherent system where your teams can move from question to answer without losing context." – base14 Scout
With these benefits in mind, the logical next step is to focus on simplifying your tool stack for long-term improvements.
How to Get Started
The first step is conducting a focused audit to pinpoint overlapping tools and track key renewal dates. Pay special attention to friction points that slow your team down, such as manual data correlation or alerts that fail to trigger incident workflows automatically.
For engineering-aware founders, infrastructure is critical, but it doesn’t have to be a core expertise. At TechVZero (https://techvzero.com), we approach these challenges from real-world experience, not as outside observers. Drawing from our work at massive scales and with cost-saving initiatives, we recommend starting your consolidation journey by standardizing on open frameworks like OpenTelemetry. This helps you avoid vendor lock-in. From there, transition to a unified platform that aligns with your long-term cloud-native goals, as previously discussed.
How streamlining your DevOps toolchain can help you meet business goals faster
FAQs
How do I know which monitoring tools to retire first?
Start by taking a close look at all your monitoring tools. Evaluate how often they’re used, how well they integrate with your systems, and the quality of the insights they deliver. Pay attention to tools that overlap in functionality, don’t fit into your workflows, or simply aren’t being used effectively. It’s also smart to factor in costs like licensing and maintenance when deciding what stays and what goes. Assess each tool’s ability to support incident detection and response, and focus on eliminating those that contribute the least. The goal is to simplify your setup while keeping it effective.
What’s the safest way to consolidate without breaking alerts?
The best approach to combine monitoring tools without disrupting alerts is through alert grouping and correlation strategies. By using smart alert grouping, you can cut down on noise by bundling related alerts into one incident, avoiding overwhelming alert storms. Meanwhile, correlation-based alerting connects related alerts across different services, keeping context intact and reducing the chances of false alarms. These techniques help maintain smooth workflows during consolidation, ensuring critical alerting remains unaffected.
How can I prove consolidation improved MTTR and costs?
You can showcase improved MTTR (Mean Time to Resolution) and cost savings with metrics such as 60–80% faster incident resolution and over $261,000 in annual savings. These impressive results often come from more efficient monitoring workflows and fewer incidents, backed by industry data. By emphasizing these measurable outcomes, you underline the tangible benefits of consolidation efforts.