Retention Policies that Cut Observability Bills 70%+

Want to cut your observability costs by over 70%? Smart retention policies can help you save big without losing critical data. Here’s how:
- Focus on high-volume, low-value data: Identify unnecessary logs, traces, and metrics that drive up costs.
- Use tiered storage: Keep recent, high-resolution data in "hot" storage for quick access, and archive older or less critical data in cheaper "cold" storage.
- Audit your data usage: Pinpoint your biggest cost drivers using tools like Datadog’s Usage Dashboard or Prometheus retention settings.
- Adjust retention periods: Reduce retention for less critical data types (e.g., debug logs or health checks) to just a few days.
- Optimize configurations: Tools like Datadog, Elasticsearch, and Prometheus offer features like filters, Index Lifecycle Management, and remote storage to streamline costs.
Built with Elasticsearch: Cost-optimized observability
sbb-itb-f9e5962
Audit Your Current Observability Data and Retention Settings
Before tackling cost reductions, it’s crucial to identify where your money is going. An audit helps you uncover which data sources are eating up your budget and where retention settings might need adjustments. This step lays the groundwork for achieving the significant cost savings discussed later. It’s all about focusing on impactful changes rather than wasting time on minor tweaks.
Measure Data Ingestion Volumes and Storage Costs
Start by identifying your biggest cost drivers. In Datadog, use the Usage Attribution Dashboard to locate high-volume log sources, and check the Metrics Summary to find metrics with high cardinality. Typically, the top 10 log indexes account for 80% of log volume and 90% of logging costs.
For Prometheus, open the Prometheus Web UI (navigate to Status → Runtime & Build Information) to inspect active retention settings. Key metrics to monitor include prometheus_tsdb_head_series and prometheus_tsdb_symbol_table_size_bytes. For context, a standard three-node cluster using the kube-prometheus setup typically sends around 900 samples per second to a managed service.
Pay attention to high-cardinality tags, such as User IDs or UUIDs in metrics, and verbose log levels (e.g., DEBUG logs or health checks). These tend to generate unnecessary data volume. For example, increasing a Prometheus sampling interval from 10 seconds to 60 seconds can reduce sample volume by 83%.
Review Existing Retention Policies
Next, take a close look at your retention settings. For Prometheus, you can run the following command to check retention settings:
curl -s http://localhost:9090/api/v1/status/runtimeinfo | jq '.data.storageRetention'. By default, Prometheus retains data for 15 days unless configured otherwise.
In Datadog, examine Exclusion Filters and Retention Filters in the Logs section. The Estimated Usage Dashboard can help you break down ingestion by service, source, or team. Use "Log Patterns" to spot repetitive, low-value messages like "Sent [undefined] in [X]ms" that can be excluded or sampled. Adjust retention settings based on audit findings to focus on high-volume, low-value data.
"Don’t chase the tail – apply the 80/20 rule to your optimizations and configurations (e.g., don’t chase < 1% volumes with index optimizations)." – Datadog
Check for "catch-all" indexes or default storage buckets. These often contain untagged or misconfigured data sources that can waste significant storage space.
Find Low-Value Data to Remove or Reduce
Identify data that can be trimmed or eliminated entirely. Verbose logs, routine health checks, noisy infrastructure logs, duplicate error logs from retries, and high-cardinality metrics are common culprits.
For example, excluding verbose logs and duplicate errors can lead to massive savings. CloudPosse’s Lambda Forwarder filter, which excluded health check logs, reduced daily indexed logs by 41% and saved $12,500 per month. Similarly, a Fortune 500 retailer implemented 12 exclusion rules for 23 million daily logs in Datadog, cutting log management costs by 58%.
Focus on data with a short lifespan. Traces, for instance, often lose their usefulness after 2–14 days, while metrics can be downsampled for long-term storage. Reducing log retention from 15 days to 3 days can save about 37% on storage costs. Additionally, delete dashboards that haven’t been accessed in over three months, and stop collecting metrics that aren’t used in any active dashboards or alerts.
Once your audit is complete, you’ll be ready to fine-tune retention policies across your observability tools for maximum efficiency.
Configure Retention Policies in Prometheus, Elasticsearch, and Datadog
Fine-tuning retention settings in Prometheus, Elasticsearch, and Datadog can lead to significant cost savings – over 70% in some cases. The idea is simple: keep high-resolution data for immediate troubleshooting while archiving or removing older, less useful data. Each platform handles retention differently, so let’s break down how to configure them.
Prometheus: Set Up Metrics Retention
Prometheus retention relies on two key command-line flags: --storage.tsdb.retention.time (to set how long data is stored) and --storage.tsdb.retention.size (to limit storage space). When either limit is reached, the oldest data is deleted. For example:
--storage.tsdb.retention.time=30d --storage.tsdb.retention.size=50GB This setup keeps about 30 days of data while capping storage at 50GB to avoid disk overflow.
To save disk space, enable WAL compression using --storage.tsdb.wal-compression. This can cut disk usage by around 50% with minimal CPU impact. To plan your storage needs, use this formula:
needed_disk_space = retention_time_seconds * ingested_samples_per_second * bytes_per_sample Prometheus typically uses 1–2 bytes per sample after compression.
For long-term storage, use the remote_write feature to send data to external backends. This allows you to keep detailed data locally for 7–14 days for active debugging, while older data is stored remotely. You can also use recording rules to create aggregated metrics (e.g., daily averages) that last longer than raw data.
| Environment | Retention Period | Storage Limit | Purpose |
|---|---|---|---|
| Development | 3–7 days | ~10GB | Quick debugging and testing |
| Staging | ~14 days | ~25GB | Integration testing |
| Production | 30–60 days | 100GB+ | Incident response and planning |
| Compliance | 1 year+ | Varies | Regulatory audits (requires remote storage) |
Elasticsearch: Set Up Index Lifecycle Management (ILM)
Elasticsearch uses Index Lifecycle Management (ILM) to automate how data is stored and eventually deleted. ILM organizes data into five phases: Hot (active), Warm (read-only), Cold (infrequent access), Frozen (rarely accessed), and Delete (permanent removal). New indices are created automatically when the current one reaches a size (e.g., 50GB) or age (e.g., 30 days).
To configure ILM, create a policy that defines these phases. For example, in the Hot phase, set rollover criteria, and in the Delete phase, define when data should be removed (e.g., after 90 days). Then, attach this policy to a component template, such as logs@custom. Avoid editing built-in policies; instead, duplicate them and make changes to the copy.
Apply the component template to an index template that matches your data (e.g., logs-*-*). If you need changes to apply immediately, use the _rollover API to force a new index. To save storage, enable force merge in the Warm phase, reducing data to a single segment. Assign roles like data_hot, data_warm, and data_cold to nodes so older data moves to cheaper hardware.
Datadog: Filter Traces to Reduce Storage
Datadog separates trace ingestion from retention. While all traces are ingested for real-time metrics, retention filters decide which spans are stored for up to 15 days. These filters are crucial for managing APM storage costs.
By default, Intelligent Retention Filters keep 100% of errors, high-latency traces, and a representative sample of traffic. You can also create custom filters to retain specific data. For instance, you might:
- Retain all traces tagged with
env:prodorservice:payment-gateway. - Sample less critical environments (e.g., development or staging) at 1–5%.
- Retain only traces longer than 5 seconds to focus on debugging slow requests.
To identify which services consume the most storage, monitor the Usage Metrics in the Trace Pipeline view. Implement and track these policies to confirm their impact on storage costs.
Use Tiered Retention Across All Tools
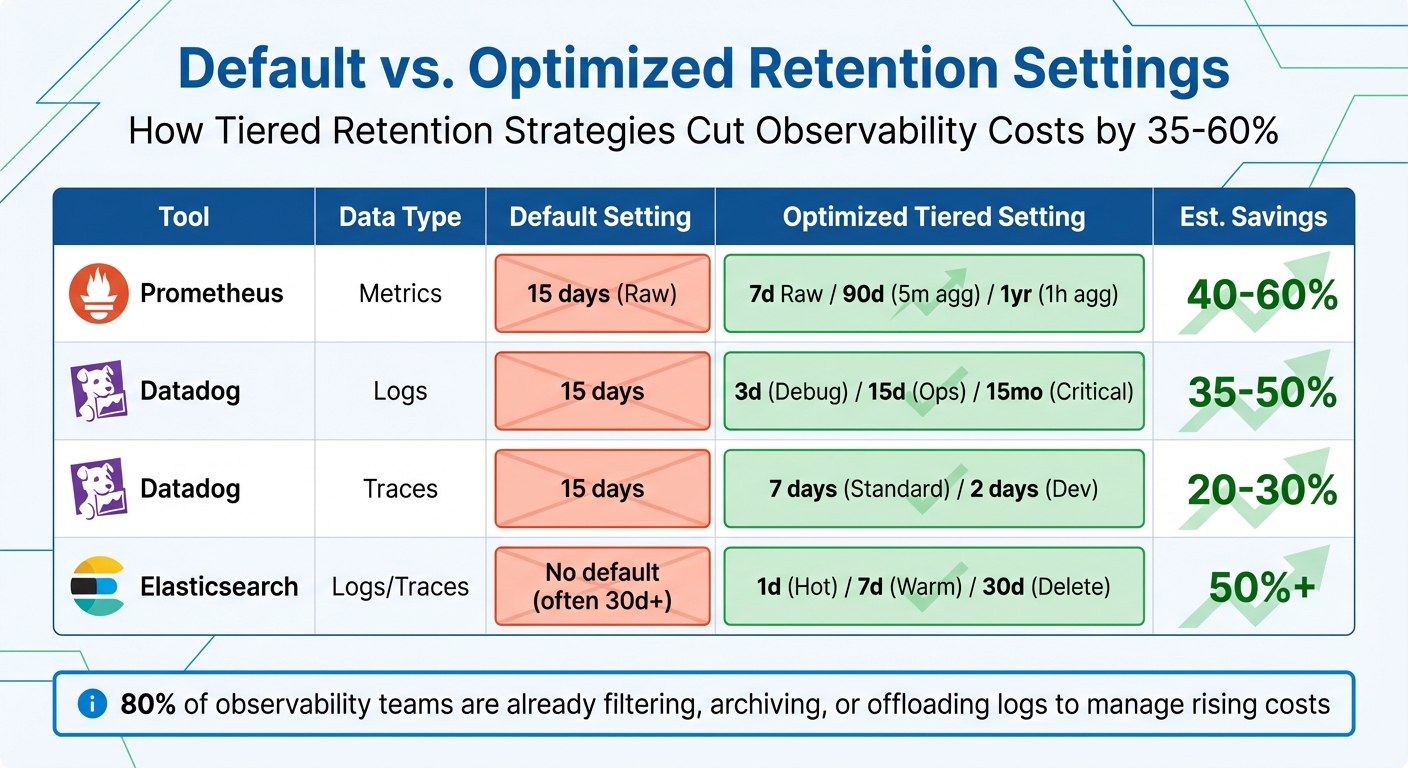
Default vs Optimized Observability Retention Settings Cost Savings Comparison
Create a Tiered Retention Strategy
A tiered retention strategy helps you balance storage costs with how often your data is accessed. The idea is simple: keep high-resolution data close at hand for immediate troubleshooting, and move older data to cheaper storage or condense it into summaries. Not all observability signals hold their value equally – traces, for example, are most useful within a few days, while metrics can guide long-term capacity planning.
Here’s how you can structure your storage into three tiers:
- Hot storage: Store high-resolution data, like 10-second metrics or full trace spans, for 0–7 days. This ensures quick access for debugging active production issues.
- Warm storage: Retain medium-resolution or filtered data for 14–30 days. This tier supports performance analysis and post-incident evaluations.
- Cold storage (archive): Use low-cost options like Amazon S3 to store aggregated or downsampled data for 90+ days. This helps meet compliance needs without overspending.
Tag-based retention can refine this approach even further. By applying tags like env:prod or dept:finance, you can prioritize critical business units with longer retention periods, while limiting data from less critical environments (like env:staging) to just 3–7 days.
"The 90-Day Baseline approach works best for SMBs – start with 90-day retention for core metrics, then adjust based on actual usage patterns and compliance needs." – Datadog’s SMB Success Team
For example, a healthcare provider saved 35% on storage costs in January 2025 by archiving patient logs after 90 days while still adhering to HIPAA compliance.
Once you’ve set up your tiered retention strategy, compare your refined settings to default configurations to see how much you could save.
Compare Default vs. Optimized Settings
Now that you have a tiered retention plan, it’s time to assess how default settings stack up against your optimized setup. Many observability tools come with default retention settings designed for ease of use rather than cost efficiency. For instance:
- Prometheus defaults to 15 days of local storage.
- Datadog retains logs for 15 days and metrics for 15 months.
- Elasticsearch often stores data indefinitely unless manually cleaned up.
While these defaults might work for small deployments, they can lead to skyrocketing costs as your data grows.
Switching to a tiered retention strategy can cut costs by 35–58%. Here’s how you can optimize retention for specific tools:
- Prometheus: Keep 7 days of full-resolution data locally, generate 5-minute aggregates for 90 days, and store 1-hour summaries for up to a year.
- Datadog: Adjust retention by data type – debug logs for 3 days, operational logs for 15 days, and business-critical logs for 15 months.
- Elasticsearch: Use Index Lifecycle Management (ILM) to roll over indices daily, move them to warm storage after 7 days, and delete them after 30 days.
The table below shows how optimized settings compare to default ones:
| Tool | Data Type | Default Setting | Optimized Tiered Setting | Est. Savings |
|---|---|---|---|---|
| Prometheus | Metrics | 15 days (Raw) | 7d Raw / 90d (5m agg) / 1yr (1h agg) | 40–60% |
| Datadog | Logs | 15 days | 3d (Debug) / 15d (Ops) / 15mo (Critical) | 35–50% |
| Datadog | Traces | 15 days | 7 days (Standard) / 2 days (Dev) | 20–30% |
| Elasticsearch | Logs/Traces | No default (often 30d+) | 1d (Hot) / 7d (Warm) / 30d (Delete) | 50%+ |
Striking the right balance between visibility and budget is critical. In fact, 80% of observability teams are already filtering, archiving, or offloading logs to manage rising costs.
Deploy and Monitor Your Retention Policies
Deploy Policies Step by Step
Introducing retention policies effectively requires a careful, phased approach to ensure everything runs smoothly. Start by auditing your current usage to pinpoint major cost drivers. Often, a small group of noisy services, debug logs, or health checks will account for the bulk of your data volume – think of it as the 80/20 rule in action.
Roll out policies gradually, beginning with high-volume, low-priority data sources. For example, in Prometheus, you can adjust the global retention period in your settings. With Elasticsearch, Index Lifecycle Management (ILM) lets you automate the data lifecycle, transitioning indices through Hot, Warm, Cold, and Delete phases. A typical setup might involve daily index rollovers, moving data to warm storage after seven days, and deleting it entirely after 30 days. Datadog offers options like exclusion filters to drop low-priority logs (e.g., health checks) as they’re ingested and retention filters to control how long indexed data is stored.
Once you’ve implemented these changes, keep a close eye on key metrics like Prometheus storage usage or Datadog ingestion rates to ensure the policies are working as planned. Automate backend checks to confirm outdated data is actually being deleted. Be ready to make adjustments – if your incident response team struggles due to missing data, you may need to increase retention for critical services while keeping shorter periods for less essential environments like staging.
To further control costs, configure agents to drop nonessential logs directly at the source. Aim for a sampling rate of 10–15% for excluded log types. Once your policies are deployed, the focus shifts to tracking their impact on cost and compliance.
Track Cost Savings and Policy Compliance
After activating your retention policies, it’s important to measure their effectiveness. Use your observability tools to monitor real-time costs. For instance, Datadog’s Billing dashboard provides insights into ingestion trends and estimated monthly expenses. Break down costs by team, service, or environment using tags like team:engineering or env:prod to pinpoint where the most spending occurs.
Set up multi-level alerts to stay ahead of budget overruns. For example, configure a warning alert when you hit 90% of your monthly budget and a critical alert at 110%, calculated on a seven-day rolling average. You can also establish daily quotas and set warning thresholds at 80% of these quotas to catch unexpected data spikes before they spiral out of control. Cost monitors tagged by team can help you quickly identify which areas are overspending.
Keep an eye on data movement between storage tiers to ensure cost-effectiveness without sacrificing performance. Metrics like query latency and data rehydration times are key indicators that moving data to cheaper tiers hasn’t slowed down troubleshooting efforts. To maintain control, limit "Modify Index" permissions to a central admin team and monitor changes using audit tools like Datadog’s Audit Explorer. It’s also helpful to maintain an internal wiki that outlines retention periods for different data types, so engineering teams have a clear understanding of what’s available and for how long.
"Retention policies are not exciting, but they are the difference between sustainable observability costs and runaway storage bills." – Nawaz Dhandala, Author at OneUptime
Conclusion
Cutting observability costs by 70% or more doesn’t mean sacrificing visibility – it’s about focusing on what truly matters. This guide has laid out actionable steps: review your current data usage, fine-tune retention settings, leverage tiered storage, and monitor the results consistently. These strategies are already helping companies slash costs while maintaining essential insights.
The trick is balancing cost efficiency with operational needs. For instance, traces typically lose their relevance after 48 hours, while metrics are vital for long-term analysis. By using intelligent sampling and setting shorter log retention periods, you can achieve meaningful savings without jeopardizing visibility.
Start with a 15-day retention period for metrics, adjust as needed based on usage patterns, and set size-based caps (e.g., 50GB) to avoid unexpected cost surges. Filter out unnecessary debug logs and health checks at the source, but retain a 10–15% sampling rate for excluded log types to avoid blind spots in your monitoring.
These steps are just the beginning. Retention policies need regular updates. As your infrastructure grows and new services are added, revisit your settings to ensure they align with your evolving business needs. Document these retention policies in an internal wiki so teams can quickly understand what data is available during incident response.
FAQs
How do I choose the right retention periods for logs, metrics, and traces?
To determine the right retention periods, you need to weigh three key factors: cost, data value, and compliance requirements. For instance, critical information like error logs or security events should be kept for longer periods, while less important data can have shorter retention times.
A smart approach is to use tiered storage policies. Store recent, high-resolution data in faster, more expensive storage, while moving older, aggregated data to cheaper storage options. This keeps costs under control without sacrificing access to important insights.
Additionally, focus on filtering out low-value data and sampling logs. Align your retention strategy with compliance regulations to ensure you’re meeting legal requirements while minimizing expenses. This way, you can preserve essential insights without overspending.
What’s the safest way to cut observability data without hurting incident response?
Balancing cost savings with the need to preserve essential data is key when setting up data retention policies. A tiered retention strategy works well – keeping recent, high-priority data readily accessible while archiving or deleting less critical information. Techniques like intelligent sampling (such as tail-based sampling) help focus on the most relevant data, while excluding unnecessary logs, like debug information, trims storage needs. Additionally, storing detailed data only when absolutely necessary and summarizing older data can cut costs without affecting your ability to respond effectively to incidents.
How can I measure cost savings after changing retention and sampling?
To get a clear picture of cost savings, start by monitoring your spending on metrics, traces, and logs using real-time dashboards. This will help you track changes before and after adjustments. Next, calculate the Total Cost of Ownership (TCO) for your observability stack, and compare the costs from before and after implementing changes. Make it a habit to review these metrics regularly to ensure you’re saving money without sacrificing the quality or value of your observability tools.