Best Practices for SLO Scalability in AI Systems

Scaling AI systems is challenging due to unpredictable workloads, inconsistent inference times, and resource contention. Service Level Objectives (SLOs) help manage these complexities by setting measurable performance targets for metrics like latency, throughput, and error budgets. Here’s a quick summary of strategies to scale AI systems effectively while maintaining reliability:
- Define AI-Specific Metrics: Focus on latency, throughput, and GPU/TPU utilization. Use percentiles (e.g., P99) to monitor performance variations.
- Burn Rate Alerts: Detect issues early by tracking how quickly the error budget is consumed. Use multi-window alerts to reduce false positives.
- Automated Scaling: Use SLO-driven policies to scale resources dynamically based on real-time performance data.
- Monitor Across Lifecycles: Track SLOs during training, validation, and production stages to ensure consistent performance.
- Dynamic Traffic Routing: Distribute workloads intelligently to maintain SLO compliance during updates or scaling.
- Bare Metal Infrastructure: Reduce costs and improve performance consistency by bypassing virtualization and directly accessing hardware.
From 0 to Tens of Thousands of SLOs in Under a Year: How Expedia Group Used Automation to Scale

sbb-itb-f9e5962
How to Implement Scalable SLO Frameworks
SLO Burn Rate Alert Thresholds for AI Systems
Creating a scalable SLO framework for AI services means addressing AI’s unpredictable behavior by tracking precise metrics, setting targeted alerts, and automating responses. This includes handling challenges like variable inference times, GPU contention, and bursty traffic. Here’s how to put it into action.
Define AI-Specific SLIs and Prioritize Metrics
Start by categorizing your AI service and assigning specific SLIs. For example, user-facing inference demands low latency and high availability, while training pipelines focus on throughput. Feature stores, on the other hand, prioritize data freshness.
For AI workloads, focus on latency, traffic, errors, and saturation – especially GPU/TPU utilization. Saturation is a key indicator for scaling decisions. Monitoring GPU and TPU usage helps you act before latency degrades.
Use percentiles instead of averages. AI systems often have skewed distributions, where rare but complex inference requests take significantly longer. Monitoring P99 or P99.9 latency captures this "long tail." As Udi Hofesh, Head of Kommunity at Komodor, explains:
"If the AI-monitored 99.9th percentile behavior is good, you can be mathematically confident that the typical user experience is excellent".
Separate real-time and batch workloads to avoid conflicts. For instance, set one SLO for real-time inference with P95 latency under 100ms and another for batch jobs with throughput of 1,000 records per second.
| AI Service Category | Primary SLI | Key Metric Example |
|---|---|---|
| User-facing Inference | Latency & Availability | P95 Inference Latency < 100ms |
| Generative AI | Throughput & Latency | Tokens per second; Time to first token |
| Training Pipelines | Throughput | Records processed per second |
| Feature Stores | Durability & Latency | Data freshness; Feature retrieval time |
| Model Quality | Correctness | Model drift; Prediction accuracy score |
Begin with loose targets and refine them as you gather production data. Use tools like Prometheus to pre-compute complex SLIs – like error ratios or 30-day availability – so dashboards load quickly and scaling triggers respond promptly.
This level of precision lays the foundation for proactive scaling, discussed further in the burn rate alerts section.
Use Burn Rate Alerts for Early Scaling
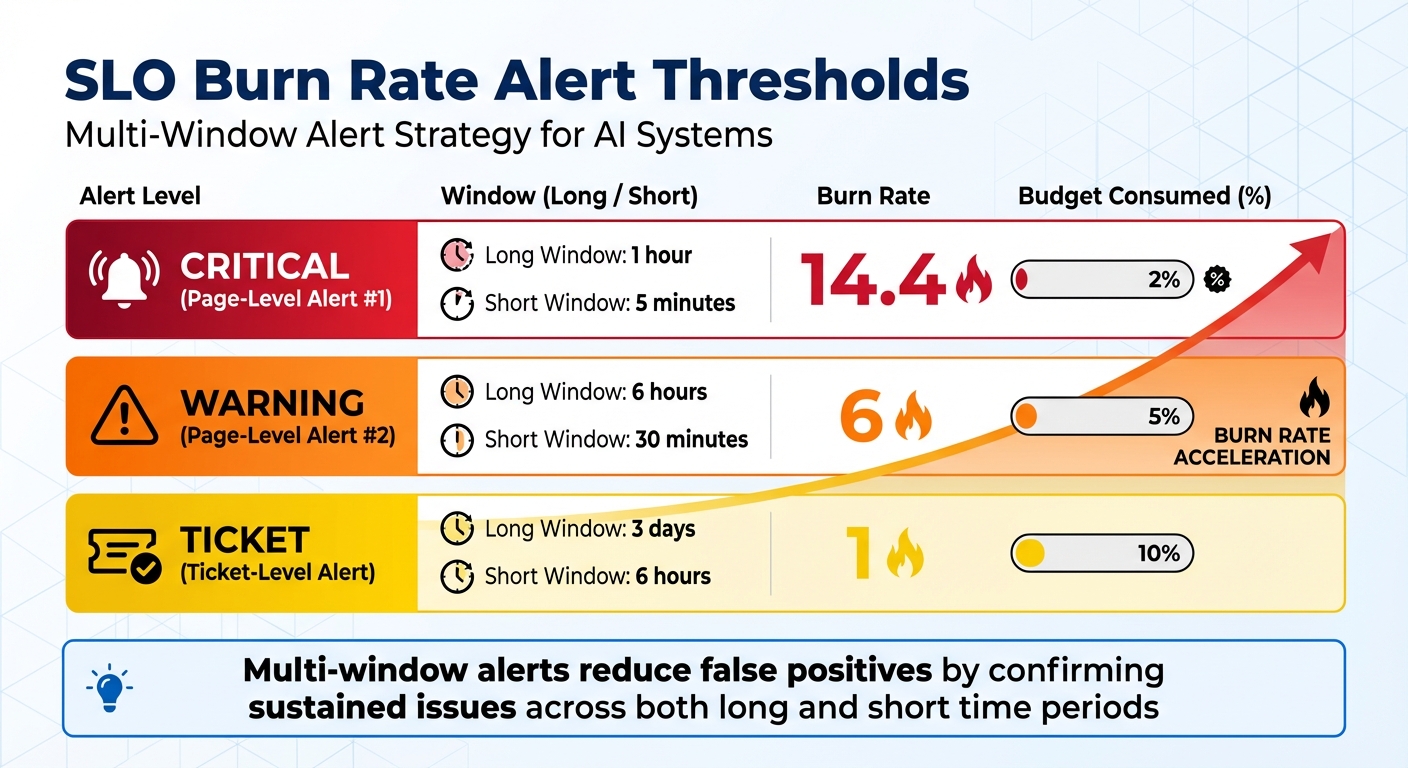
Burn rate alerts are crucial for detecting issues before they impact performance. These alerts measure how quickly your service is consuming its error budget. For example, a burn rate of 1 means the error budget is being used at the expected pace, while a burn rate of 14.4 indicates that 2% of the monthly error budget is being consumed in just one hour.
To minimize false positives, use multi-window alerts. Pair a longer window (e.g., 1 hour) to detect sustained problems with a shorter window (e.g., 5 minutes) to confirm ongoing issues. For instance, you could trigger a page-level alert when the burn rate exceeds 14.4 over both a 1-hour and 5-minute window. A ticket-level alert might activate when a burn rate of 1 persists for 3 days and 6 hours (indicating 10% budget consumption).
| Severity | Long Window | Short Window | Burn Rate | Budget Consumed |
|---|---|---|---|---|
| Page | 1 hour | 5 minutes | 14.4 | 2% |
| Page | 6 hours | 30 minutes | 6 | 5% |
| Ticket | 3 days | 6 hours | 1 | 10% |
For AI systems, connect burn rate alerts to relevant metrics like jetstream_prefill_backlog_size (for latency-sensitive tasks) and jetstream_slots_used_percentage (for throughput-heavy workloads). For example, when the prefill queue grows and the burn rate spikes, it’s a clear signal to scale out resources before users experience degraded performance.
In January 2026, the LatencyPrism system was rolled out across thousands of XPUs. Over six months, it enabled real-time, batch-level monitoring with alerts triggered in milliseconds. Impressively, it achieved an F1-score of 0.98 in distinguishing normal workload variations from actual anomalies – without requiring code changes.
Automate Scaling with SLO-Driven Policies
To ensure consistent reliability, automate scaling decisions based on real-time SLO performance. Manual scaling often comes too late, potentially exceeding the error budget by the time action is taken.
Configure Horizontal Pod Autoscalers (HPA) to scale based on AI-specific metrics. For latency-sensitive tasks, use jetstream_prefill_backlog_size. For throughput-heavy workloads, monitor jetstream_slots_used_percentage. When prefill queues grow, additional instances should spin up automatically. Set a scale-down stabilization window (e.g., 5 minutes) to avoid premature downscaling during temporary traffic dips.
For hardware-bound tasks, keep an eye on HBM usage and trigger scaling when it exceeds 75%.
In September 2024, the Faro system was implemented using Ray Serve on a Kubernetes cluster to manage multiple ML inference jobs. By leveraging probabilistic prediction and "sloppified" utility functions, Faro reduced SLO violations by up to 23× compared to other systems at the time.
Automate scaling actions: trigger an outscale when the 1-hour burn rate exceeds 14.4, and scale in when it stays below 2 for 30 minutes.
"If you set SLOs that are meaningful, understood, and represented in metrics, you can configure alerting to notify an on-caller only when there are actionable, specific threats to the error budget."
– Steven Thurgood, SRE, Google
Establish clear budget policies. For example, freeze new feature deployments if the error budget falls below 10%, and halt non-critical changes if it drops below 5%. Automate these policies through your CI/CD pipeline to enforce them without manual intervention.
Integrating SLOs into MLOps Pipelines
Expanding on the importance of scaling strategies, incorporating Service Level Objectives (SLOs) into MLOps pipelines ensures reliable performance across the entire workflow. By embedding SLOs into your processes, you can monitor and maintain performance from the initial stages of training all the way through to production. This level of oversight helps prevent unnoticed performance declines and ensures that AI systems remain dependable as workloads fluctuate.
Monitor Performance Across Model Lifecycles
Tracking SLOs at every stage – training, validation, and production – is essential. During training, focus on metrics like data freshness, which measures how recently the model was updated with new data. This is particularly important for time-sensitive applications like weather forecasting, where outdated data can compromise accuracy. Before deploying a model to production, run automated validation checks. Compare the new model’s performance metrics against the current production baseline and confirm that the infrastructure (memory, compute power, accelerators) can support the new version.
Once in production, use dashboards to compare metrics across different model versions. For example, Domino monitors latency metrics (P50, P95, P99) using Grafana. If Version 2 of a model shows worse latency than Version 1, teams can quickly pinpoint whether the problem lies in the model itself or the underlying infrastructure. Alex Glenn, SRE Manager at Domino, explains:
"The goal: repeatable, evidence-based MLOps that scales across the organization."
To stay ahead of issues, integrate drift detection to identify data shifts early. Feedback loops are also critical – they allow you to capture ground-truth labels and calculate real-world precision and recall. Industry data indicates that around 67% of AI initiatives fail to meet expectations due to undetected drift and unreliable predictions. These insights directly inform scaling decisions, tying back to earlier discussions on proactive scaling strategies.
This lifecycle-wide monitoring lays the groundwork for dynamic traffic routing, enabling real-time adaptability.
Dynamic Traffic Routing for SLO Maintenance
Dynamic routing ensures SLO compliance during updates or scaling events by intelligently distributing traffic between model versions. Model-aware gateways can route compute-heavy tasks, such as large language model (LLM) inference, to GPU/TPU-optimized instances, while simpler tasks are sent to CPU-optimized backends. This complements automated scaling policies and ensures efficient resource use.
For example, the Faro system has shown success in dynamically allocating resources at scale. Similarly, LatencyPrism provides fast, non-intrusive monitoring for LLM workloads, helping maintain performance.
To further enhance flexibility, decouple your MLOps components – such as data ingestion, training, and serving – using APIs. This modular approach allows you to scale or update individual components without impacting system-wide SLOs. When traffic surges or performance dips, automated triggers can reroute requests or spin up additional resources based on real-time SLO metrics, eliminating the need for manual adjustments.
Cost-Effective SLO Scalability with Bare Metal Infrastructure
Advantages of Bare Metal for AI Workloads
Bare metal infrastructure offers a direct path to hardware resources like GPUs, CPUs, and NVMe storage by bypassing the hypervisor layer. This eliminates virtualization overhead, reduces latency spikes, and ensures consistent performance – key factors when Service Level Objectives (SLOs) demand sub-10ms inference latency for real-time applications like autonomous systems [26,29,34].
From a cost perspective, bare metal stands out. Its fixed monthly pricing includes compute, storage, and bandwidth in a single, predictable bill. Compare this to managed cloud services, which often charge separately for storage, data transfer (around $0.09 per GB), and support, leading to billing fluctuations of 30–40% each month [27,30]. For instance, in January 2026, OpenMetal‘s Large v4 configuration (32 cores, 512GB RAM, 12.8TB NVMe) cost $1,173.60 per month, while the equivalent setup on AWS was priced at $4,010 – a nearly 50% cost reduction.
Performance consistency is another major draw. Unlike shared cloud environments, where "noisy neighbors" can disrupt workloads, bare metal dedicates 100% of the hardware to your AI system. This ensures the precision required for millisecond-level SLOs [26,28]. For AI workloads that averaged $85,521 per month in 2025 – a 36% year-over-year increase – such predictability is vital for scaling without compromising SLO commitments.
These factors are driving specialized providers to unlock even greater potential in bare metal infrastructure.
TechVZero‘s Approach to Bare Metal Scalability
TechVZero builds on the strengths of bare metal to deliver cost efficiency and operational reliability at scale. Operating across 99,000+ nodes, TechVZero has consistently demonstrated how bare metal can meet demanding SLOs with stable, low-latency performance. In one case, the company saved a client $333,000 in a single month while simultaneously mitigating a DDoS attack. This illustrates how bare metal infrastructure can deliver both cost savings and robust operational resilience. TechVZero’s pricing model reflects this confidence: they take 25% of the savings for one year, and nothing if they fail to meet performance benchmarks.
For startups and engineering-focused teams, TechVZero simplifies the often-daunting task of migrating Kubernetes workloads to bare metal. This approach offers the same reliability as managed cloud services but at 40–60% lower costs, eliminating the need for in-house specialists. Historical data shows that moving from public cloud to bare metal can reduce total infrastructure costs by 30–50% while maintaining strict SLO compliance.
"The future of AI infrastructure isn’t just about scale – it’s about smart investment. And for many, that means going back to the metal".
TechVZero’s expertise has proven invaluable in deployments where dedicated bandwidth and direct hardware access are essential for preserving latency SLOs. By eliminating unexpected egress fees, bare metal becomes a reliable and cost-effective choice for teams running continuous AI training and inference workloads.
Conclusion: Building Reliable and Scalable AI Systems
Scaling AI systems with Service Level Objectives (SLOs) requires a careful balance of reliability, flexibility, and cost management. By leveraging error budgets, teams can strike this balance – encouraging experimentation when conditions allow, while focusing on stability when thresholds are reached.
Key methods like multi-SLO tiering, percentile-based monitoring, and AIOps-driven autoscaling have shown measurable success. These strategies have reduced violation durations by 31% and cut costs by 18%. Real-world deployments confirm these benefits, demonstrating that zero-intrusion monitoring effectively identifies genuine anomalies without disrupting services, even during workload spikes.
For AI systems, where inference can represent up to 90% of total costs, infrastructure decisions have an outsized impact. TechVZero’s model, operating across more than 99,000 nodes, has achieved impressive cost savings of 40–60%, all while adhering to strict SLO standards. Their approach even includes a performance guarantee – charging only 25% of the savings they deliver, ensuring results are both measurable and meaningful.
FAQs
How do I choose the right SLO targets for a new AI service?
To set effective SLO targets, begin by defining SLIs (Service Level Indicators) that directly represent both user experience and system performance. These could include metrics like response time, system availability, or accuracy. It’s wise to start with conservative targets – such as 99.9% availability – and refine them as your understanding and confidence in the system grow.
Make sure your SLOs align with broader business objectives. Use error budgets to strike a balance between maintaining system reliability and driving innovation. For AI-driven systems, it’s crucial to factor in specific considerations like model latency and prediction accuracy.
Finally, regularly review and adjust your targets to ensure they remain relevant as your system evolves over time. This keeps your goals in sync with both user expectations and technological advancements.
Which latency percentile should I track for inference SLOs?
Tracking the P99 latency percentile is crucial for managing inference SLOs. This metric focuses on tail latencies, which are often where performance bottlenecks first appear. By monitoring these outliers, you can catch potential regressions early – before they escalate into outages. It’s an effective way to ensure system stability and maintain consistent performance.
How do I connect burn rate alerts to autoscaling safely?
To safely connect burn rate alerts to autoscaling, start by setting clear SLOs (Service Level Objectives) with specific burn rate thresholds. These thresholds should signal when your error budget is being consumed too quickly. Configure alerts to activate when these thresholds are breached, enabling timely, proactive responses.
Next, integrate these alerts with autoscaling actions. This allows your system to automatically adjust capacity when needed, helping to prevent SLO violations. At the same time, it avoids overreacting to short-term traffic spikes, maintaining a balance between reliability and operational stability.