How Prometheus Powers Custom SLO Scripts

Prometheus simplifies managing Service Level Objectives (SLOs) by providing tools like PromQL, dimensional metrics, and recording rules. These help track reliability metrics such as availability, latency, and error budgets. Instead of aiming for unrealistic 100% uptime, SLOs set achievable targets (e.g., 99.9% availability) and define error budgets to balance reliability and innovation. While Prometheus‘s default setup works for many cases, custom scripts are essential for specific needs like aggregating metrics across services, targeting business hours, or experimenting with thresholds.
Custom SLO scripts leverage Prometheus’s API for real-time and historical data, enabling tailored monitoring and automation. By structuring metrics and labels effectively, using recording rules for precomputations, and securing API access, you can streamline SLO tracking. Proper PromQL queries calculate availability, latency, and error budget consumption. Tools like Go, Python, or Java integrate these scripts into workflows, ensuring reliability checks during deployments. Optimizing queries, managing cardinality, and addressing low-traffic challenges further enhance script performance.
Prometheus empowers teams to monitor SLOs accurately, automate reliability checks, and improve service health without overloading resources.
SLOconf 2023 – Kubernetes Monitoring: Choosing Optimal Metrics for SLO Alerting – Shubham Srivastava
Prometheus and SLO Fundamentals
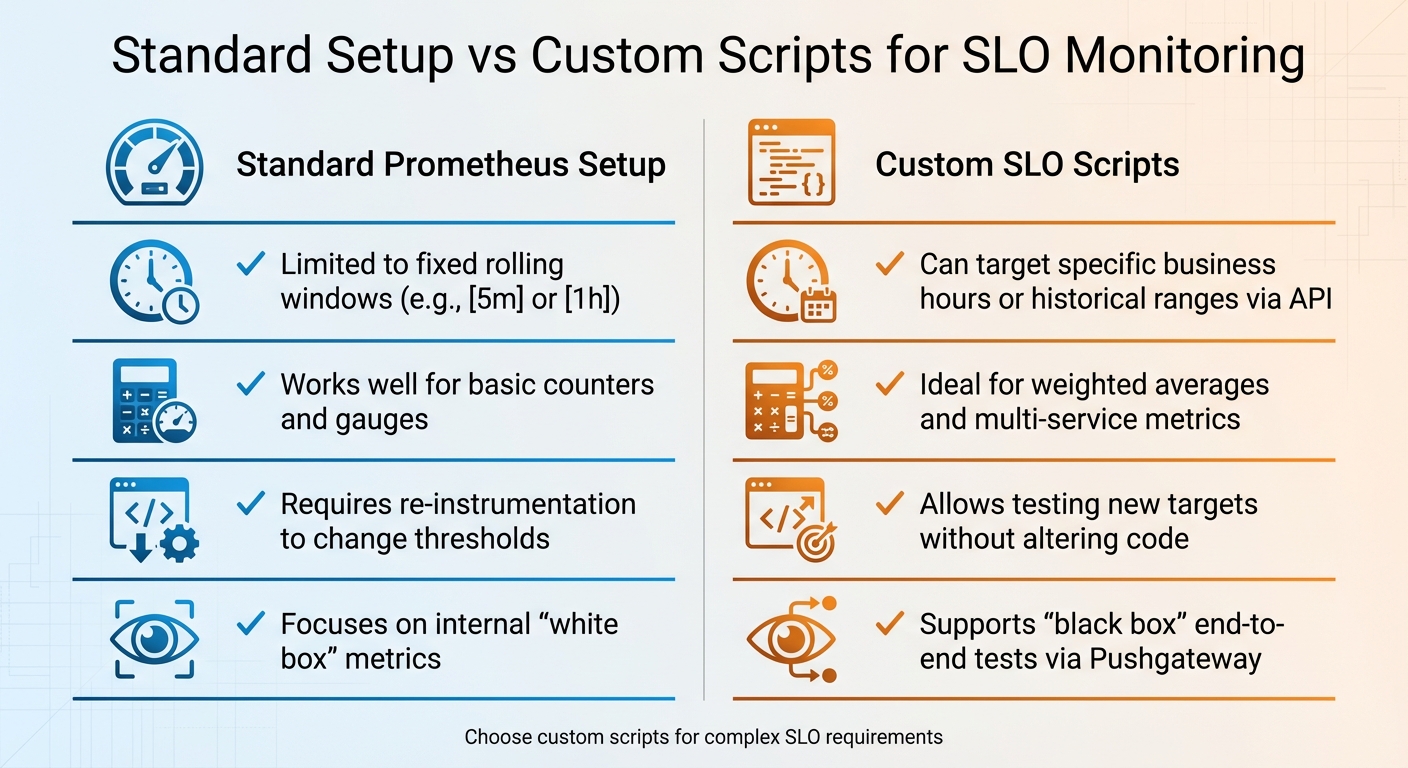
Standard Prometheus Setup vs Custom SLO Scripts Comparison
SLOs, SLIs, and Error Budgets Explained
Service Level Indicators (SLIs) are the raw data points that reflect your system’s performance – like an API responding within 200 ms or 15 errors occurring out of every 1,000 requests. In Prometheus, these metrics often come from counters (such as http_requests_total, which tracks request success rates) or histograms that measure latency distributions. Essentially, an SLI is a straightforward metric: for instance, your API either responded in 200 ms, or 15 out of 1,000 requests failed.
Service Level Objectives (SLOs), on the other hand, set a target for these measurements. For example, an SLO might specify that 99.9% of requests must succeed over a 30-day period. The difference between 100% perfection and your SLO target defines your error budget – the allowable margin for failure before reliability takes a hit. For a 99.9% availability target, this translates to about 43.2 minutes of downtime per month.
"An SLO defines the tolerable ratio of measurements meeting the target value to all measurements recorded within a specified time interval." – mkaz.me
Prometheus calculates these ratios using PromQL, dividing the number of successful events by the total events. For extended timeframes, like 30 days, recording rules pre-compute these ratios to save resources and prevent expensive queries every time a dashboard refreshes. When the error budget runs out, it’s a clear signal to prioritize reliability improvements over new feature development. While these standard approaches work for many situations, some cases demand a more tailored approach, which is where custom scripts come into play.
When to Use Custom Scripts for SLOs
Although Prometheus’s default setup handles many scenarios effectively, there are times when custom scripts are essential. For instance, the standard configuration works well for basic up/down checks, but it may struggle with more specific requirements. Custom scripts are especially useful for calculating SLOs during specific timeframes, such as business hours (e.g., 8:00 AM to 6:00 PM), aggregating metrics across multiple instances, or implementing advanced scoring systems like Apdex.
Another situation where custom scripts shine is in cross-service aggregation. If you’re managing a microservices architecture, combining latency metrics from multiple APIs often requires weighted averages – a task that’s difficult to achieve with standard Prometheus recording rules. Custom scripts also enable "black box" monitoring, which evaluates services from an external perspective. For example, you could simulate a user login flow and push the results to Prometheus via a Pushgateway.
The PromQL bool modifier is particularly useful in these scenarios. It converts threshold checks (e.g., "latency < 250ms") into binary values (1 for success, 0 for failure). These binary results can then be averaged over time to calculate an availability percentage. This approach allows latency-based SLOs to be treated similarly to uptime calculations. Custom scripts also make it easier to experiment with different thresholds – say, testing a 250 ms latency target versus a 400 ms target – without needing to modify your application code.
| Standard Setup | Custom Scripts |
|---|---|
| Limited to fixed rolling windows (e.g., [5m] or [1h]) | Can target specific business hours or historical ranges via API |
| Works well for basic counters and gauges | Ideal for weighted averages and multi-service metrics |
| Requires re-instrumentation to change thresholds | Allows testing new targets without altering code |
| Focuses on internal "white box" metrics | Supports "black box" end-to-end tests via Pushgateway |
For example, imagine calculating SLOs for a service sampled every 15 seconds over a 90-minute period. That would involve 361 individual data points. Custom scripts can help manage edge cases, like missing data, by using techniques such as the vector[11] method to treat downtime as failures.
Setting Up Prometheus for Custom SLO Scripts
How to Structure Metrics and Labels
When naming metrics, stick to a clear and consistent format: use a single-word application prefix followed by a unit suffix and a type suffix. This makes it easier to quickly identify metrics during incidents. For example, time should always be measured in seconds, storage in bytes, and percentages as ratios between 0 and 1. If you’re monitoring request failures, track them with two separate counters – one for total requests and another for failures – instead of combining them into a single metric with a "success/fail" label.
Labels play a crucial role in distinguishing different characteristics of your metrics, such as operation="create" or stage="transform". However, avoid using labels for high-cardinality data like user IDs or email addresses, as each unique label combination generates a new time series, which can lead to excessive storage demands. For counters, always include the _total suffix (e.g., http_requests_total), and steer clear of colons in metric names since they are reserved for recording rules.
"Colons (‘:’) are reserved for user-defined recording rules. They SHOULD NOT be used by exporters or direct instrumentation." – Prometheus Documentation
With these guidelines in place, you can move on to precomputing data using Prometheus recording rules.
Creating Prometheus Recording Rules
Recording rules allow you to precompute complex PromQL expressions – such as error rates or SLI ratios – and store them as new time series. This reduces the computational load on your scripts. Define these rules in YAML files, and include them in your main prometheus.yml configuration under the rule_files section. Stick to a naming convention like level:metric:operations, such as job:http_requests:rate5m, to make the purpose of each rule immediately clear.
When calculating SLO ratios, always aggregate the numerator and denominator separately before dividing. For instance, sum all errors and all requests independently, then divide the totals to ensure accuracy across multiple instances. Use a without clause to drop unnecessary labels while keeping essential ones like job or service. This helps avoid metric collisions. Before deploying any changes, validate your rules with the command promtool check rules /path/to/rules.yml. Additionally, if one SLO metric depends on another precomputed metric, group them together in the same rule file to ensure the most up-to-date data is used.
Once your recording rules are set, the next step is securing your Prometheus API for safe integration with custom scripts.
Securing API Access
Protecting API access is essential to maintain the integrity of your custom SLO scripts and metrics. Since Prometheus doesn’t include built-in authentication, it’s best to place it behind a reverse proxy or API gateway. For basic protection, use a reverse proxy like Nginx to enable username and password authentication. In more complex environments, integrate oauth2-proxy with identity providers like GitHub or Google for secure access. Never expose the Prometheus API directly to the public internet – network isolation is a must.
All API traffic should be encrypted with TLS, and your scripts should include exponential backoff logic to handle HTTP 429 (Too Many Requests) responses. When writing queries in your scripts, use label matchers like {job="service-name"} to ensure precise data access and to avoid unintended collisions. If you’re using managed services like Grafana Cloud, double-check that Cloud Access Policies and role-based access controls are correctly configured to prevent "no data" errors.
Writing PromQL Queries for SLO Scripts
Using PromQL effectively is crucial for crafting SLO scripts that provide accurate insights into service reliability.
Building Availability and Latency Queries
Availability measures the ratio of successful events to total events over a specific timeframe. For HTTP services, calculate it by dividing non-5xx responses by all requests:
sum(rate(http_requests_total{status!~"5.."}[5m])) / sum(rate(http_requests_total[5m])) This query calculates the percentage of successful requests in the last five minutes.
For uptime, use the up gauge metric:
avg_over_time(up{job="service"}[1h]) This shows the percentage of successful scrapes over the past hour. Adding an offset modifier, like offset 2m, ensures data ingestion is complete before querying.
Latency SLOs rely on histogram buckets to assess the proportion of requests completed within a specific duration. For example, to find the percentage of requests finished in under 200 milliseconds:
sum(rate(http_request_duration_seconds_bucket{le="0.2"}[5m])) / sum(rate(http_request_duration_seconds_count[5m])) For percentile-based latency, such as the 99th percentile, use:
histogram_quantile(0.99, sum by (le) (rate(metric_bucket[5m]))) This helps identify the latency experienced by 99% of users.
To handle missing data, apply the or 0 * sum(...) pattern, ensuring the output defaults to 0 when no data is available.
These metrics form the foundation for calculating error budget consumption.
Computing Error Budget Consumption
Once you have availability and latency metrics, you can calculate your error budget to monitor service health. For example, a 99.9% availability SLO allows for an error budget of 0.1% of total requests. Track how quickly this budget is being consumed with:
(1 - (success_rate / total_rate)) / (1 - SLO_threshold) This formula highlights if your error budget usage is unsustainable.
High burn rates often signal trouble. For instance, consuming your error budget at 14.4 times the sustainable rate would deplete a 30-day budget in just 24 hours. To track this, use recording rules to calculate five-minute rates and aggregate these for long-term reporting. This approach avoids overloading Prometheus with resource-heavy 30-day range queries.
Simplify complex metrics by converting them into binary values with the bool modifier (e.g., <bool 0.4). Feeding these values into avg_over_time helps streamline error budget calculations across different time windows.
Selecting Time Windows and Improving Query Performance
Custom scripts should use specific durations like [5m] or [1h]. Always prefer rate() over irate() for SLO calculations. While rate() averages over the entire time window, smoothing out spikes, irate() focuses on the most recent data point and can be more volatile.
To reduce server load, apply label matchers before aggregation. Use sum by or without clauses to limit the number of time series Prometheus processes.
"Querying the precomputed result will then often be much faster than executing the original expression every time it is needed." – Prometheus Documentation
Test queries in Prometheus’ Table view to ensure the result set is manageable. For complex expressions, use recording rules to precompute results, enabling faster dashboard performance.
sbb-itb-f9e5962
Running Custom SLO Scripts with Prometheus
After crafting your PromQL queries, the next step is integrating them into automated monitoring scripts to keep tabs on your Service Level Objectives (SLOs).
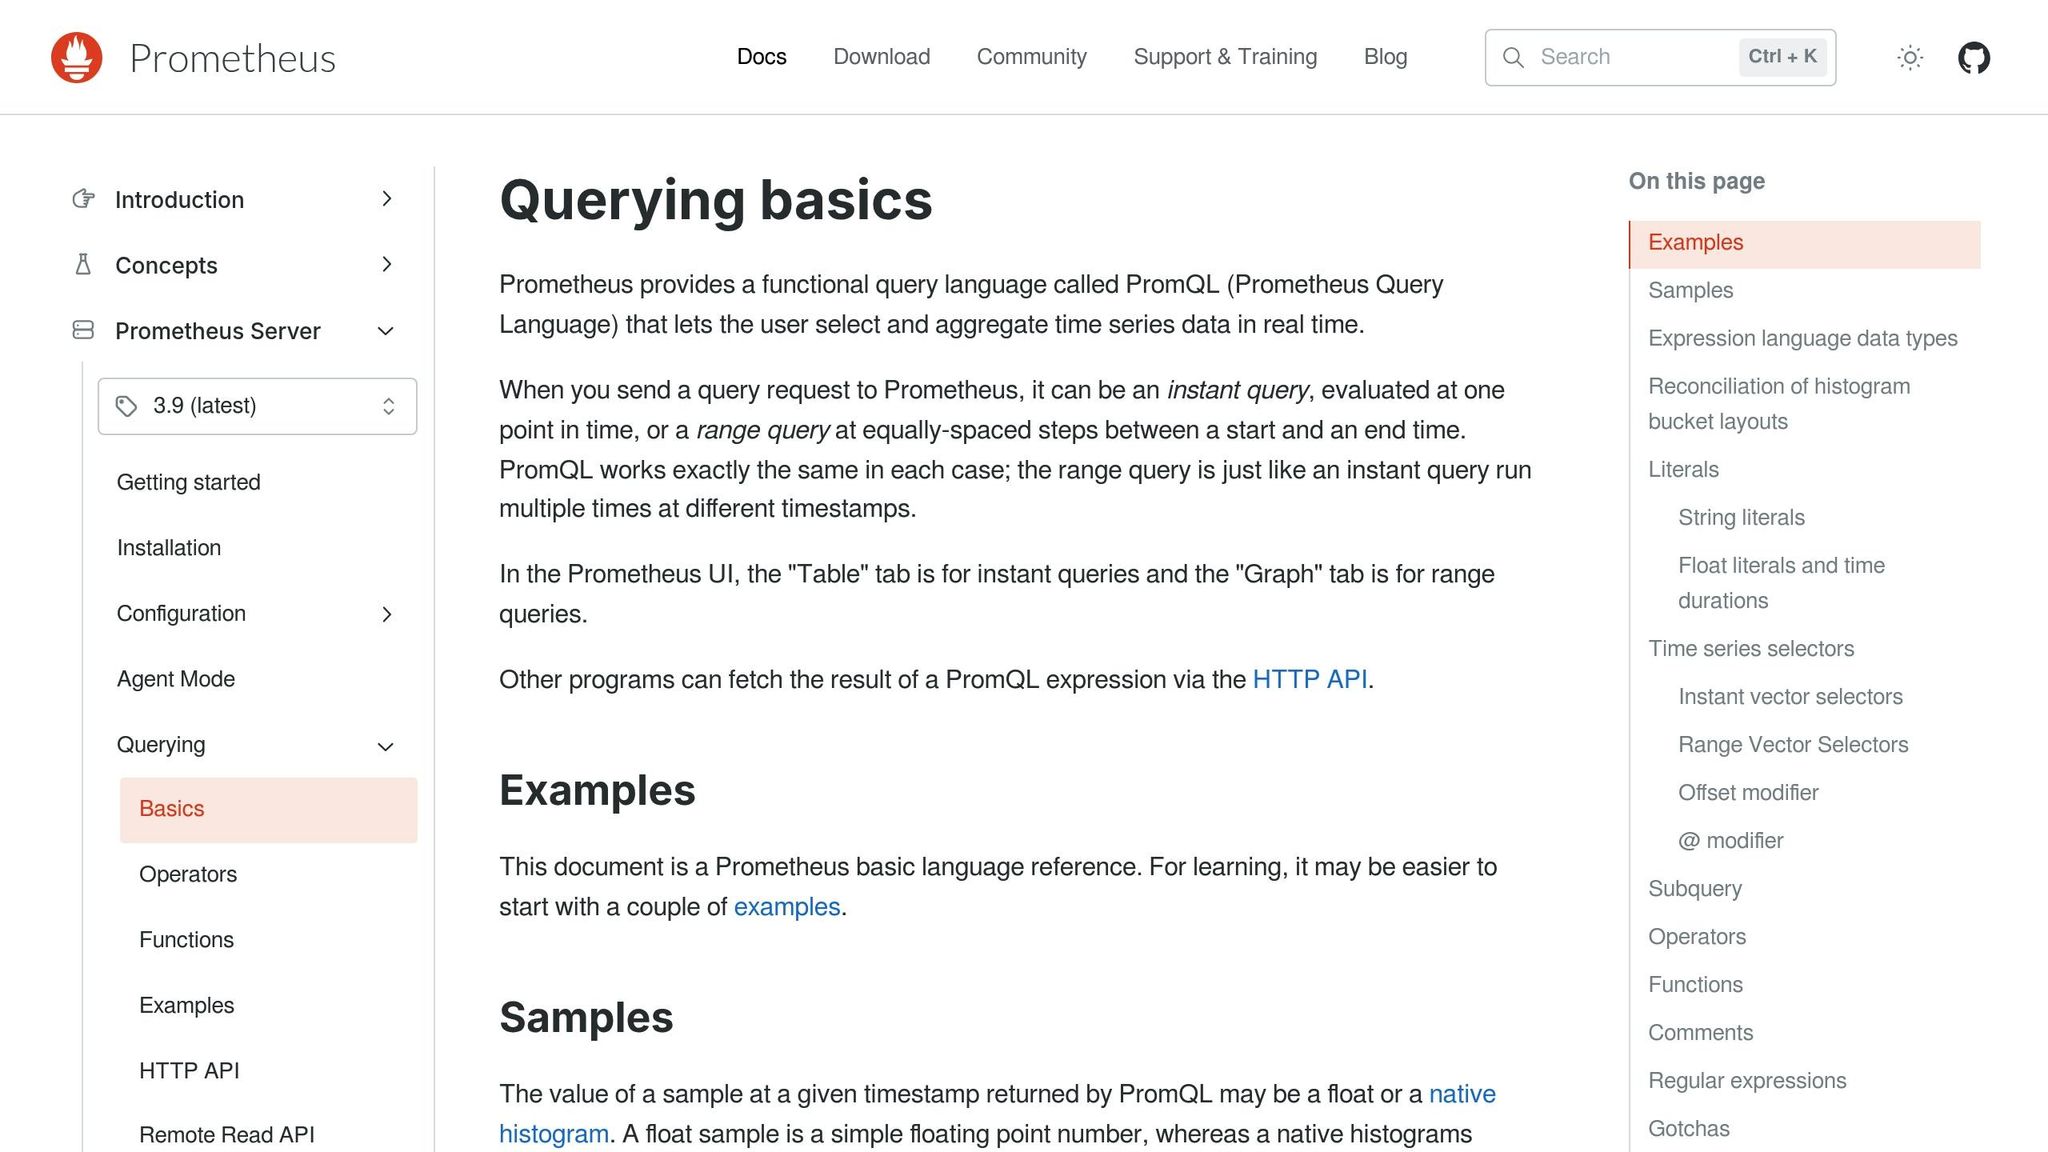
Using the Prometheus API
Custom SLO scripts interact with Prometheus through its HTTP API, located at /api/v1. To get real-time metrics like availability or error rates, use instant queries via /api/v1/query. For historical trends – such as tracking error budget usage over time – opt for range queries through /api/v1/query_range. These evaluate your PromQL expressions at regular intervals. If you’re working with long or complex queries, use POST requests with the Content-Type: application/x-www-form-urlencoded header to bypass URL length restrictions.
The API responds in JSON format, including a status field. Always confirm that this field reads "success" before processing the results. Additionally, check for warnings, which could indicate issues like high cardinality or missing data. To explore active metrics, you can query endpoints like /api/v1/series or /api/v1/labels.
| API Endpoint | Method | Primary Use Case for SLOs |
|---|---|---|
/api/v1/query |
GET/POST | Real-time availability and current SLO status |
/api/v1/query_range |
GET/POST | Historical error budget tracking and trend analysis |
/api/v1/series |
GET/POST | Discovering active targets for dynamic SLO reporting |
/api/v1/rules |
GET | Verifying that recording rules for SLOs are loaded and healthy |
Keep in mind that Prometheus has a default five-minute lookback period when evaluating queries.
Now that the API’s capabilities are clear, the next step is selecting the right language and tools to execute your scripts effectively.
Selecting Languages and Tools for Scripts
Prometheus provides official client libraries for Go, Python, and Java, making these excellent choices for building custom SLO scripts.
- Go: As Prometheus’s native language, Go is perfect for high-performance scripts and custom exporters.
- Python: Ideal for ease of use and powerful data processing capabilities.
- Java: A strong option for enterprise setups relying on JVM-based infrastructure.
For CI/CD pipelines, shell scripts using curl and jq can query the API and halt deployments if an SLO threshold is breached. If your script runs as a batch job, consider sending results to a Pushgateway. For better monitoring, export a gauge for the last successful run and another for script execution time.
As an example of efficiency, a Java counter can increment in approximately 12–17 nanoseconds, showcasing the low overhead of basic instrumentation.
Adding SLO Scripts to Your Workflow
Once your API queries and scripting tools are ready, the next step is integrating SLO checks into your deployment process. This involves querying the API during your CI/CD pipeline to evaluate the canary deployment’s error rate against the production baseline. If the canary exceeds its error budget, the deployment should be paused.
For multi-window alerting, compare long-term and short-term error budget usage. For example, a burn rate of 14.4 (consuming 2% of the budget in an hour) is a common threshold for paging an engineer. Lower-severity issues, like a 1× burn rate over three days consuming 10% of the budget, may only trigger a ticket.
"If you set SLOs that are meaningful, understood, and represented in metrics, you can configure alerting to notify an on-caller only when there are actionable, specific threats to the error budget." – Steven Thurgood, SRE, Google
When working with metrics derived from recording rules, use an offset of two minutes (e.g., offset 2m) to avoid evaluating incomplete data from the most recent interval. This prevents false positives caused by partially ingested metrics.
For services with low traffic, you might need to aggregate related microservices into a single SLO or introduce synthetic traffic using probers. This adjustment ensures that the signal remains meaningful, as a few failed requests could otherwise trigger unnecessary alerts, even when the service is functioning well.
Fixing and Improving Custom SLO Scripts
Fixing Common Script Problems
Sometimes, your custom SLO scripts might run into issues, but the good news is that they’re often fixable. For example, if your application doesn’t emit a metric, you’ll see empty query results. To avoid this, initialize all counters to zero when your application starts up. If that’s not an option, you can use a pattern like (sum(up{job="my_service"}) or vector(0)) to ensure the query returns zero instead of "no data".
Another common problem is stale data. Prometheus marks a time series as stale if it stops receiving samples, but queries may still return the last known value for up to five minutes due to the default lookback period. This can lead to your SLO script using outdated information. To avoid this, always check timestamps in API responses to make sure you’re working with fresh data.
Invalid aggregations can also throw off your SLO calculations. For instance, averaging ratios or taking the average of an average doesn’t work – it’s statistically meaningless. A better approach is to aggregate numerators and denominators separately, then divide them to calculate the error rate.
Optimizing Queries and Metrics
Once you’ve addressed basic script issues, the next step is to optimize your queries. Query performance largely depends on the number of time series selected and the volume of raw samples processed. To make your queries more efficient, start by filtering with resource attributes like service_name or namespace. This allows Prometheus to use its indexes effectively.
Watch out for high cardinality, which can drag down performance. Try to keep cardinality below 10 for most metrics. Labels like user_id or request_id can quickly balloon a single metric into thousands of time series, eating up RAM and CPU. Removing these high-cardinality labels from metrics used in SLO calculations can make a big difference.
Another way to improve performance is by using recording rules. These pre-calculate expensive SLO aggregations, shifting the computational load to ingest time rather than query time. This reduces the risk of timeouts and improves overall script reliability. If you’re working with counter-based SLOs, use rate() instead of irate(). The irate() function only looks at the last two data points, making it too volatile for stable calculations.
These strategies not only improve query performance but also help ensure your scripts are ready for low-traffic or highly dynamic environments.
Making Scripts More Reliable
Low-traffic scenarios can pose unique challenges for SLO scripts. A few failed requests in a low-traffic service might trigger false alerts even when the system is functioning normally. To address this, you can aggregate related microservices into a single SLO or introduce synthetic traffic using probers to simulate activity.
The absent() function can also be a lifesaver. It helps you distinguish between zero errors (a good thing) and a service that has stopped reporting metrics altogether (a bad thing). Additionally, when querying recording rules, apply a consistent two-minute offset to avoid incomplete data.
Conclusion
Prometheus and custom scripts offer scaling teams the flexibility to monitor SLOs in ways that go beyond off-the-shelf solutions. By making use of PromQL’s real-time aggregation capabilities and its API, you can automate SLO tracking effectively.
Achieving success, however, requires careful setup and ongoing adjustments. Start by configuring precise queries and validating your recording rules with tools like promtool before deployment. Stick to a clear and consistent naming convention – such as level:metric:operations – to keep your metrics organized and easy to interpret. Following the best practices shared in this guide will help you avoid common errors and ensure your scripts operate smoothly.
Recording rules play a critical role in managing computational load by shifting it to ingestion time. Without them, you could encounter timeouts, missed evaluations, or even gaps in your SLO data.
As your systems grow and change, your SLOs will need to evolve too. Harness SRM highlights this well: "A myth about SLOs is that they are static in nature. As technology, capabilities, and features change, SLOs need to adapt with them". Regularly evaluate query performance, retire outdated metrics, and adjust SLO targets based on real-world service data.
FAQs
What are the benefits of using custom SLO scripts with Prometheus?
Custom SLO scripts let you turn Prometheus metrics into focused, business-oriented reliability targets that go beyond simple, static alert thresholds. By using PromQL, you can define exactly the labels, time windows, and error-budget formulas that are critical to your service. Plus, these scripts can double as recording rules, making queries faster and more efficient while keeping resource consumption low.
Since these scripts integrate directly with your existing metrics setup, they adapt seamlessly to deployment changes and can be version-controlled alongside your infrastructure code. This makes it easy to refine SLOs as needs shift, set custom thresholds (like error rates for specific endpoints), and troubleshoot problems using the same queries that drive your alerts. The result? A clear and efficient system for managing reliability goals – built on an open-source platform that steers clear of vendor lock-in.
TechVZero encourages using custom SLO scripts to stay in full control of your reliability metrics while meeting the precision and clarity demands of modern SaaS products.
How do I secure my Prometheus API when running custom SLO scripts?
To keep your Prometheus API secure while running custom SLO scripts, it’s essential to focus on access control and encrypted communication. Prometheus operates under the assumption that its endpoints aren’t publicly exposed, so it’s crucial to place them behind a trusted network or a reverse proxy with proper authentication and encryption.
Here’s how to secure your API:
- Use TLS encryption: Protect data during transmission by configuring your server with a certificate and private key.
- Implement authentication: Opt for basic authentication or an external auth proxy like OAuth2. Avoid storing passwords in plain text to enhance security.
- Restrict network access: Place Prometheus on a private subnet and allow traffic only from trusted IPs, such as those used by your SLO scripts or CI runners.
- Limit API exposure: Disable endpoints and features you don’t need, like
/debug/pprofor dynamic configuration reloads, to reduce potential vulnerabilities. - Regularly update credentials: Treat passwords and private keys as sensitive data and rotate them frequently to maintain security.
By combining encryption, authentication, and strict access controls, you can safeguard your Prometheus API while ensuring it supports accurate and reliable SLO calculations. This layered security approach reduces risks without overcomplicating your setup.
What are the best practices for creating PromQL queries to monitor SLOs?
To craft effective PromQL queries for monitoring Service-Level Objectives (SLOs), it’s essential to focus on accuracy, performance, and maintainability. Begin by identifying the exact metric you need and avoid using broad or generic label matchers. Instead, opt for specific filters to keep queries efficient and reduce the load on Prometheus. For time-based calculations, leverage functions like rate() or increase(), ensuring the time window aligns with your SLO evaluation period – for example, using a 5-minute rate for a 1-hour SLO.
When aggregating metrics, select the appropriate operator based on your goal. Use sum for total counts, histogram_quantile for latency percentiles, and by or without clauses to manage label dimensions effectively. To streamline query performance and simplify maintenance, move complex computations into recording rules. This allows Prometheus to precompute results, making them easier to reuse in dashboards or alerts.
For structured SLO definitions, focus on four key components: the metric, target value, good-to-total ratio, and time window. Keep numerator and denominator queries separate to enhance clarity and flexibility. Use explicit label filters to avoid pulling in irrelevant data, and rely on Prometheus’ native histogram functions for precise latency calculations. By following these guidelines, your PromQL queries will remain efficient, scalable, and capable of delivering accurate SLO metrics.