SLO Reporting Frameworks: Pyrra vs. SloK

Service Level Objectives (SLOs) are critical for defining system reliability. Tools like Pyrra and SloK simplify SLO management by automating Prometheus rule generation, but they differ in features, scalability, and user experience. Here’s a quick breakdown:
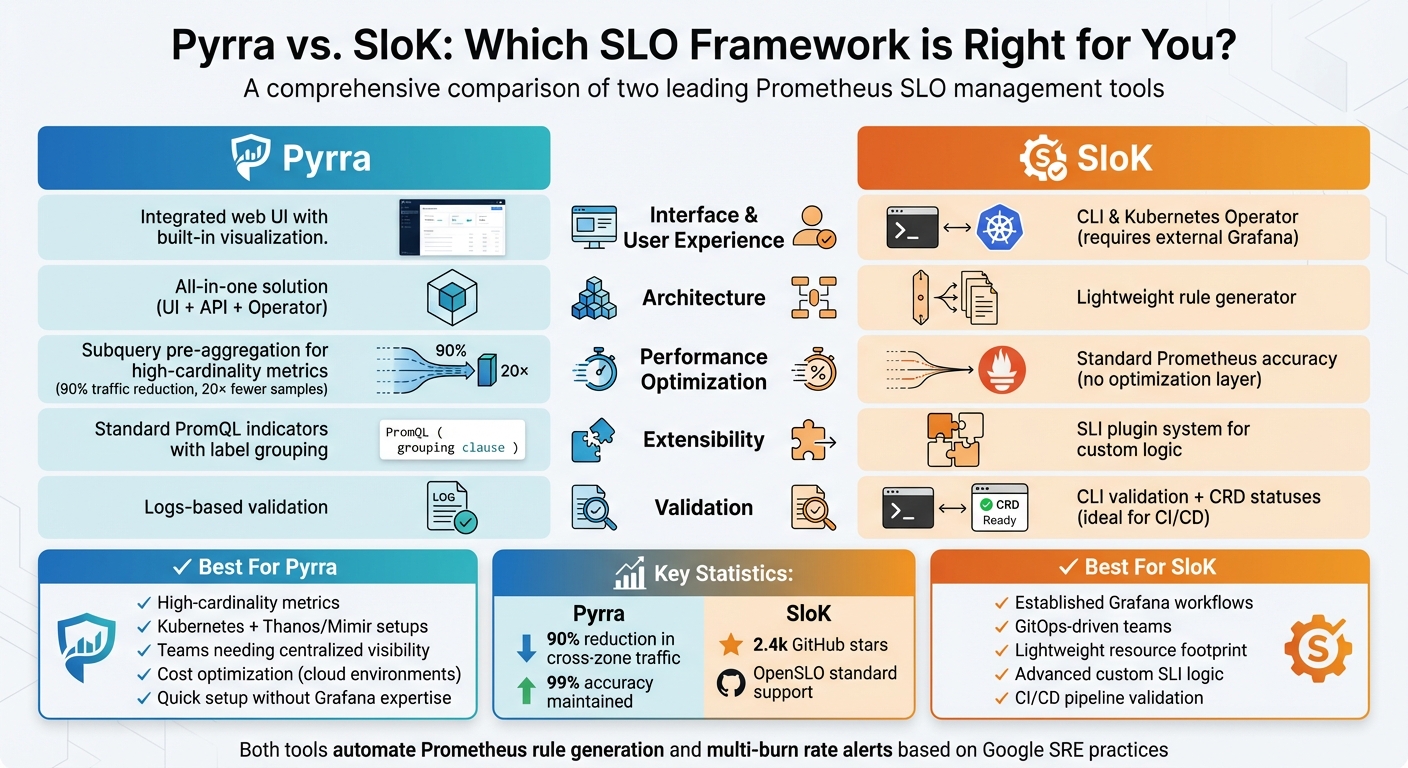
- Pyrra: Offers an integrated web UI for real-time monitoring, supports high-cardinality metrics with subquery optimizations, and is ideal for Kubernetes setups with Prometheus or Thanos. It’s great for teams needing centralized SLO visibility and reduced infrastructure costs.
- SloK: Lightweight with CLI and Kubernetes operator modes, supports advanced SLI logic via plugins, and integrates well with GitOps workflows. It relies on external Grafana dashboards for visualization, making it suitable for teams already using Grafana extensively.
Quick Comparison:
| Feature | Pyrra | SloK |
|---|---|---|
| Interface | Integrated web UI | CLI & Kubernetes Operator |
| Visualization | Built-in | External Grafana dashboards |
| Performance | Optimized for high-cardinality | Standard Prometheus accuracy |
| Extensibility | PromQL indicators | SLI plugins for custom logic |
| Validation | Logs-based | CLI & CRD validation |
Choose Pyrra for centralized monitoring and cost efficiency. Opt for SloK if you prioritize lightweight tools and advanced customization.
Pyrra vs SloK Feature Comparison for SLO Reporting
What is Pyrra?
Pyrra Basics
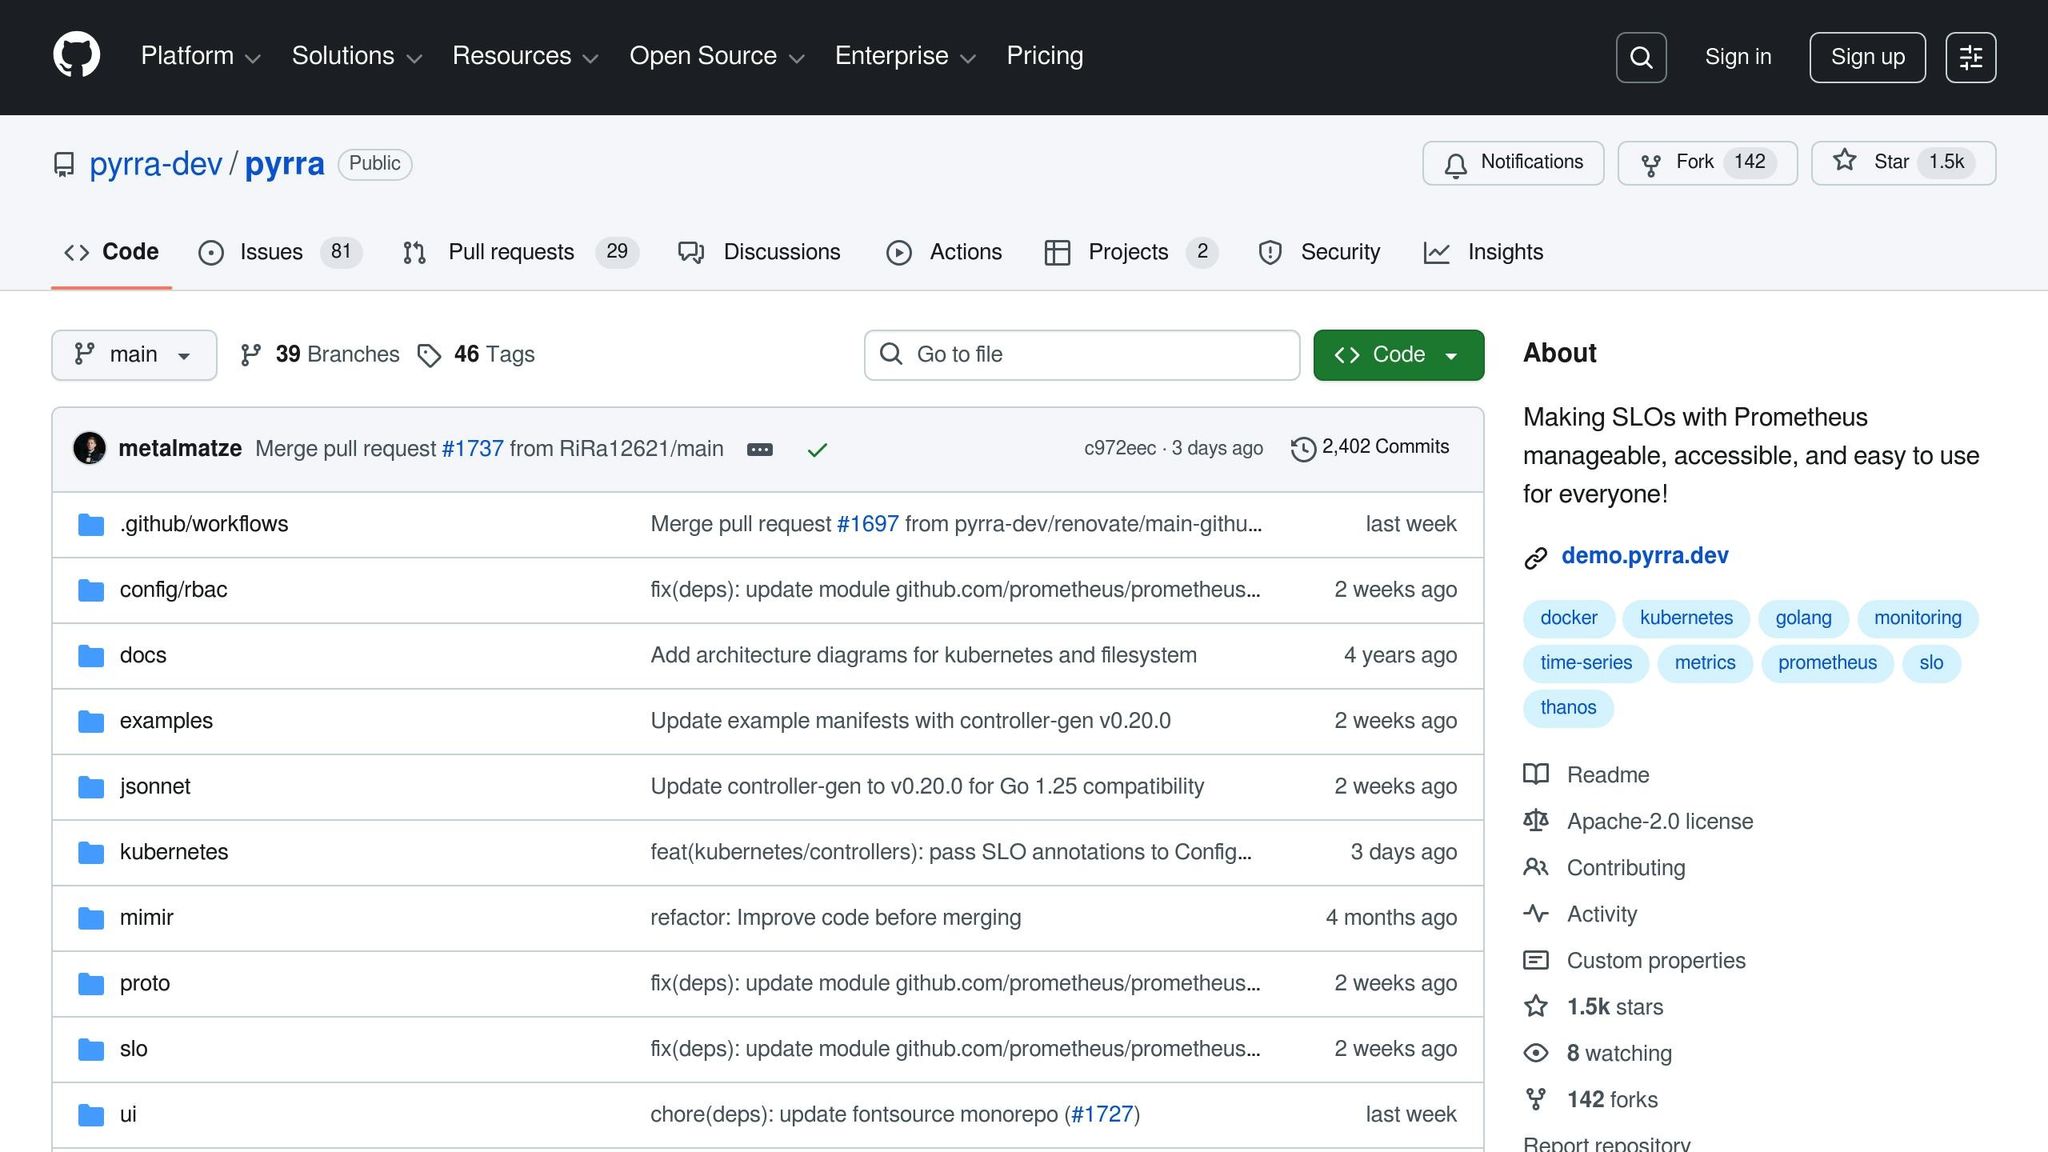
Pyrra is an open-source tool designed to simplify Service Level Objective (SLO) management for Prometheus. It operates as a single binary, combining a web interface for visualization, an API for data delivery, and a backend that monitors SLO objects while automatically generating Prometheus rules. This all-in-one approach removes the hassle of piecing together multiple tools for defining, monitoring, and visualizing SLOs.
Pyrra offers two modes of operation: it can act as a Kubernetes operator to manage ServiceLevelObjective custom resources, or it can function in a filesystem mode. The latter reads YAML definitions to generate Prometheus rules, making it compatible with Docker-based setups and managed services like Grafana Cloud or AWS Managed Prometheus.
Pyrra Features
One of Pyrra’s standout capabilities is its ability to convert high-level YAML definitions into Prometheus recording and alerting rules. This spares users from crafting complex PromQL queries. It also generates four multi-burn rate alerts with varying severities to detect error budget issues – whether they arise suddenly or develop gradually. The web interface provides a user-friendly way to search and view error budgets, remaining percentages, and RED (Requests, Errors, Duration) metrics.
Another useful feature is label grouping. This allows a single SLO definition to be automatically applied across multiple Prometheus labels, such as for different routes or services, cutting down on repetitive configurations. For metrics with high cardinality, Pyrra includes a performance mode that uses Prometheus subqueries to pre-aggregate data into 5-minute intervals. This approach maintains 99% accuracy while lowering data transfer costs and CPU usage. Pyrra also supports four indicator types: ratio (errors versus total), latency (percentage faster than a threshold), latencyNative (using Prometheus-native histograms), and bool_gauge (success/failure metrics).
When to Use Pyrra
Pyrra is particularly well-suited for Kubernetes-native setups where teams prefer managing SLOs as custom resources that integrate with the Prometheus Operator. Its web interface offers a straightforward way to monitor error budgets without needing to build complex Grafana dashboards.
For instance, the Wikimedia Foundation uses Pyrra’s filesystem mode on Thanos hosts to efficiently manage critical SLOs for their infrastructure, including Etcd. Pyrra processes configurations and generates rules for their Thanos rule service. For environments handling high-cardinality metrics – like those with thousands of endpoints or methods – Pyrra’s grouping and performance features help minimize data transfer costs and prevent CPU overload during long-term evaluations.
Next, we’ll take a look at SloK, another framework with its own unique advantages.
sbb-itb-f9e5962
What is SloK?
SloK Basics
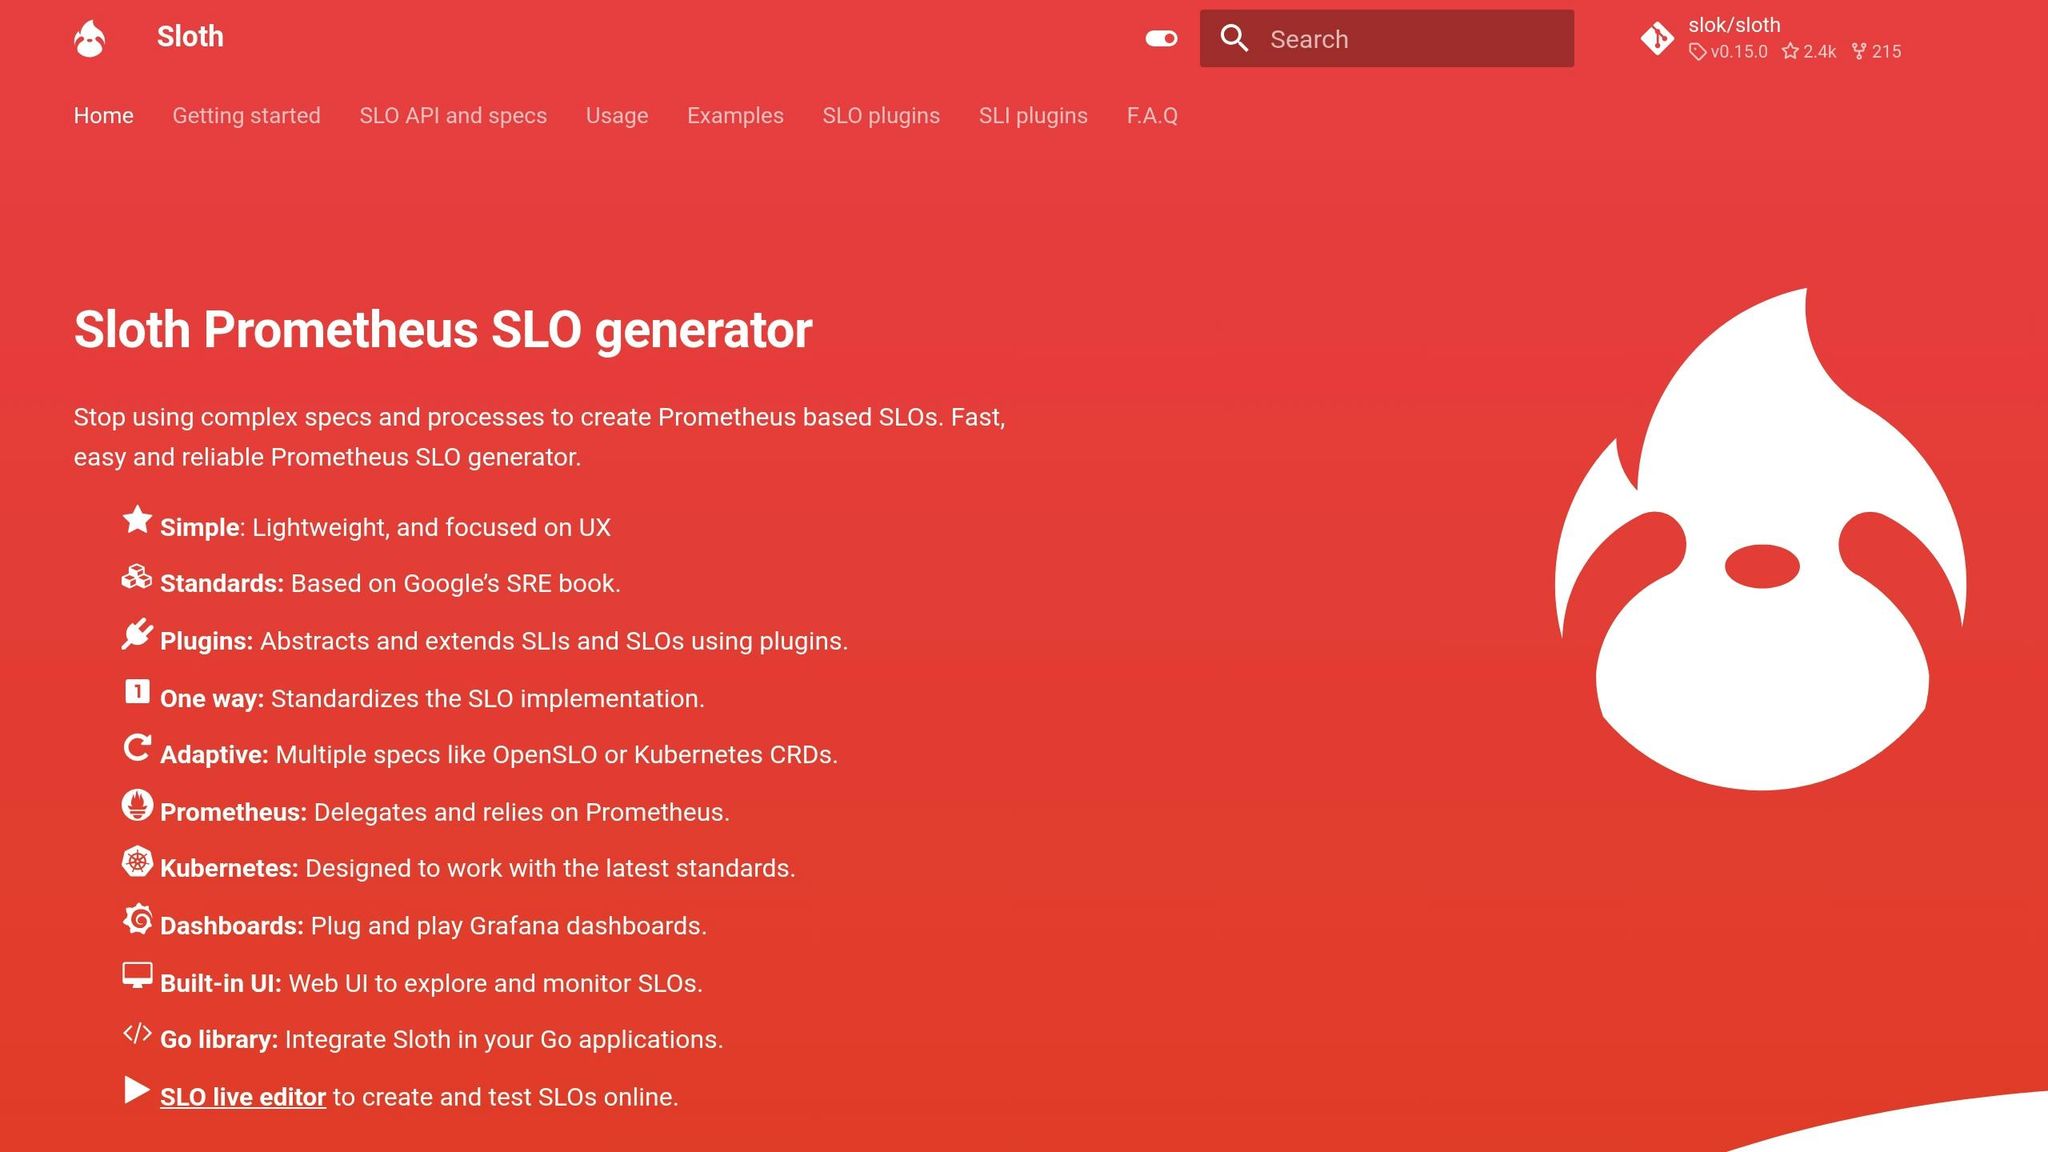
SloK, also called Sloth, is an operator-based framework designed to simplify the creation of Prometheus SLOs using straightforward YAML definitions. It takes care of generating three critical components automatically: SLI recording rules across multiple time windows, SLO metadata rules, and multi-window multi-burn alert rules (modeled after Google’s SRE practices). This automation removes the need to manually write complex PromQL queries.
SloK operates in two distinct modes:
- Single Binary CLI: Ideal for generating rules manually during one-off tasks or testing.
- Kubernetes Controller: Watches for Custom Resource Definitions (CRDs) like
PrometheusServiceLeveland manages the entire SLO lifecycle. It integrates seamlessly with the Prometheus Operator by creatingPrometheusRuleobjects.
SloK Features
One standout aspect of SloK is its SLI plugin system, which allows for handling intricate availability logic that goes beyond a single PromQL query. This keeps SLO definitions clean and reusable. Moreover, it supports both its own specification format and the widely recognized OpenSLO standard, ensuring compatibility with industry norms.
For teams using GitOps workflows, SloK offers a validate command to check SLO specifications before they reach production. This feature is a lifesaver in CI/CD pipelines, catching errors early. The framework also provides highly customizable alert configurations, letting you:
- Add custom labels and annotations.
- Route "page" alerts to PagerDuty.
- Send "ticket" alerts to specific Slack channels.
By default, SloK uses safe SLO period windows of 28 and 30 days. Its popularity is evident with 2.4k stars and 215 forks on GitHub as of early 2026.
"The fact that it can be extended with plugins makes it really interesting if you need to build complex things." – David Calvert, June 2023
These features make SloK a solid choice for teams seeking both automation and flexibility.
When to Use SloK
SloK is particularly well-suited for platform engineering teams operating entirely on Kubernetes. It’s a natural fit for organizations already using the Prometheus Operator and GitOps workflows. The validate command ensures consistency across teams, making it easier to maintain standards.
The plugin system shines in scenarios where standard Prometheus queries fall short. For example, it’s useful for excluding specific error codes or calculating ratios across multiple metrics. Since SloK doesn’t include a built-in UI, most teams use the official Sloth Grafana dashboards (IDs 14643 and 14348) for visualization. Additionally, for those preferring ConfigMap-based rule storage over PrometheusRule objects, SloK supports this option with the --config-map-mode=true flag.
Pyrra vs. SloK: Direct Comparison
Architecture and SLO Definition
Pyrra comes with an integrated web UI and API for managing SLOs, making it a more centralized solution, while SloK is a lightweight CLI/operator that generates Prometheus rules but doesn’t include its own interface. Both tools support Kubernetes CRDs or YAML files for defining SLOs, but Pyrra’s built-in visualization layer simplifies management by keeping everything in one place.
One standout feature of Pyrra is its ability to group SLOs by Prometheus labels, such as route or service, allowing users to create multiple detailed reports from a single definition. In contrast, SloK uses an SLI plugin system for handling complex logic, which can offer flexibility but requires additional setup.
| Feature | Pyrra | SloK |
|---|---|---|
| Primary Interface | Integrated web UI and API | CLI and Kubernetes Operator |
| SLO Definition | Kubernetes CRD or YAML | Kubernetes CRD or CLI YAML |
| SLO Grouping | Yes (by Prometheus labels) | No |
| Extensibility | Standard PromQL indicators | SLI plugins for custom logic |
| Validation | Logs-based | CLI and CRD statuses |
These architectural differences directly shape how users interact with each tool, which leads us to their user experience and reporting capabilities.
UI and Reporting
Pyrra’s native UI offers a user-friendly experience with features like searchable lists, filters, and detailed views. It provides availability metrics, error budgets, RED graphs, and burn rate visualizations, all in one place. Users can also customize their experience by toggling between absolute and relative chart scales, adjusting time ranges, and using tooltips for additional context.
On the other hand, SloK doesn’t include its own interface and instead relies on external Grafana dashboards for visualization. While this approach keeps SloK lightweight, it requires users to maintain separate Grafana infrastructure. For example, Wikimedia Foundation deploys Pyrra on its "titan" Thanos hosts and uses Puppet for grouping SLOs by datacenter.
"The UI is really easy to use… you’ll find the list of the configured SLOs, and have the ability to filter them by name, availability, error budget, alert status."
– David Calvert
These differences in UI design highlight how each tool caters to different user needs and workflows. Next, let’s explore how they perform under demanding conditions.
Performance and Scale
Pyrra shines in large-scale environments, particularly with high-cardinality metrics. It uses subquery pre-aggregation to optimize performance in Thanos deployments. For instance, in December 2025, Polar Signals implemented this feature to handle 340 gRPC time series over four-week windows. This reduced cross-zone Thanos traffic by 90% and cut processed samples by a factor of 20 – from 161,280 raw samples to just 8,064 pre-aggregated values – with only about a 1% accuracy trade-off compared to ground-truth calculations.
At Daimler Truck, Pyrra was used to monitor a Kubernetes observability stack processing 3,000 messages per second (7 MB/s) while maintaining 99% availability and sub-300ms latency for connected vehicle telemetry.
SloK, on the other hand, emphasizes SLO validation to ensure accuracy and catch errors in large-scale, multi-team configurations. This feature is particularly helpful in CI/CD pipelines, where broken rules can disrupt workflows.
| Feature | Pyrra | SloK |
|---|---|---|
| Scale Optimization | Subquery pre-aggregation, query caching, Thanos downsampling | SLO validation to prevent broken rules |
| Performance Mode | performanceOverAccuracy flag for high-cardinality metrics |
N/A |
| Accuracy Trade-off | ~1% difference with optimization enabled | No trade-off (relies on Prometheus accuracy) |
| Alerting | Four multi-burn-rate alerts (fixed) | Multi-burn-rate alerts with configurable labels/annotations |
These performance strategies demonstrate how each tool is tailored to specific operational needs, balancing optimization, accuracy, and scalability.
Deployment and Integration
Installation Options
Pyrra provides flexibility with multiple installation methods tailored to different infrastructures. You can deploy it using Helm charts, Jsonnet (via kube-prometheus), or standard YAML manifests. For environments outside Kubernetes, Pyrra operates as a standalone binary offering a web UI, an API, and an operator. This setup works with both Kubernetes and filesystem-based configurations. In Kubernetes, Pyrra requires two deployments: one for the API/UI and another for the operator. It has proven effective in high-throughput environments.
SloK, on the other hand, takes a simpler approach. It’s primarily a CLI tool and Kubernetes operator. You can install it via YAML for operator mode or as a standalone CLI. The CLI is compatible with Linux, macOS, and Windows, making it ideal for CI/CD validation. While its operator is Kubernetes-specific, the CLI can generate Prometheus rules in any environment.
These varied options cater to different infrastructure needs, but each comes with specific environment requirements.
Environment Requirements
The deployment method you choose will determine the necessary environment setup. Both Pyrra and SloK support Kubernetes and Docker, but their prerequisites differ. Pyrra offers a "ConfigMap mode" for Kubernetes setups without the Prometheus Operator, allowing recording rules to be stored as ConfigMaps. SloK, meanwhile, requires the Prometheus Operator for its CRD mode but can function independently as a CLI tool.
| Requirement | Pyrra | SloK |
|---|---|---|
| Orchestrator | Kubernetes or Docker | Kubernetes or any OS (CLI) |
| Metrics Backend | Prometheus, Thanos, or Mimir | Prometheus |
| Prerequisites | Prometheus Operator (optional) | Prometheus Operator (for CRD mode) |
| Configuration Format | YAML (CRD or static) | YAML (CRD) or OpenSLO spec |
| Validation | Logs-based (Webhook via cert-manager) | Built-in CLI validation |
Integration with Existing Tools
After installation, both frameworks integrate well with existing monitoring setups. Pyrra connects to Prometheus-compatible backends and generates PrometheusRule objects or static YAML files. It includes optimizations for Thanos, like disabling partial responses and enabling downsampling at 5-minute and 1-hour intervals. For Mimir, Pyrra supports multi-tenancy through tenant ID configuration. Its API also allows users to redirect to Prometheus UI or Grafana Explore for deeper query analysis.
SloK, in contrast, focuses solely on generating Prometheus rules. It doesn’t include a UI, relying entirely on Grafana for visualization.
"Defining service level objectives ensures customer success. They are easy to implement and monitor with Prometheus, Pyrra, and Grafana and provide a clear guideline for operations."
– Adrien Bestel, Principal Engineer, tb.lx (Daimler Truck)
A key distinction lies in infrastructure requirements: Pyrra needs a running API/UI pod and a backend operator, while SloK can operate as a lightweight CLI tool or Kubernetes operator. This makes SloK less resource-intensive, but you’ll need to manage separate Grafana dashboards for visualization. These features influence scalability and operational efficiency, helping teams streamline SLO reporting while balancing infrastructure costs.
Lightning Talk: Pyrra – Making SLOs with Prometheus Manageable, Accessible, and Ea… Matthias Loibl
Which Framework Should You Choose?
When deciding between Pyrra and SloK, it’s essential to consider your team’s needs, infrastructure setup, and how you approach visualization and monitoring. Both tools have their strengths, but the right choice depends on how well they align with your operational goals. Pyrra provides immediate visibility through its built-in web UI, showing SLOs, error budgets, and burn rates without requiring additional dashboard setup. On the other hand, SloK focuses on generating lightweight Prometheus rules but requires separate Grafana integration for visualization.
Go for Pyrra if your infrastructure involves high-cardinality metrics on platforms like Thanos or Mimir, especially when operating across multiple zones. Pyrra’s performanceOverAccuracy feature can significantly lower cross-zone traffic, which translates into lower infrastructure costs – particularly in cloud environments. It’s also actively developed, with frequent updates, making it a good choice for teams seeking ongoing improvements.
Opt for SloK if your team already has well-established Grafana dashboards and prefers a stable, unchanging tool. SloK is feature-complete, providing stability without introducing unexpected changes. It also supports SLI plugins for advanced use cases, such as custom metrics that go beyond standard ratios and latencies. Additionally, with its CLI validation feature, it’s an excellent fit for CI/CD pipelines, helping teams catch configuration errors before deployment.
For smaller teams or those with limited resources, Pyrra’s automatic Prometheus rule generation reduces the need for manual setup. For example, Daimler Truck’s tb.lx studio adopted Pyrra in September 2023 to monitor 3,000 messages per second, eliminating the need for manual dashboard configuration. However, if your team already has Grafana expertise and operates in a resource-constrained environment, SloK’s smaller runtime footprint might be a better fit.
It’s worth noting that Pyrra’s optimization introduces a minor 1% variance compared to raw calculations, which is generally acceptable given the significant 20× reduction in processed data. When making your choice, consider how these trade-offs align with your availability and latency tracking needs.
FAQs
Can I run Pyrra or SloK without Kubernetes?
No, you can’t run Pyrra or SloK without Kubernetes. These frameworks are designed to handle Service Level Objectives (SLOs) by leveraging Kubernetes Custom Resource Definitions (CRDs). This integration makes Kubernetes an essential part of their functionality.
How do I choose between Pyrra’s built-in UI and Grafana dashboards (SloK)?
If you’re looking for a native, integrated solution to manage SLOs, error budgets, and burn rates – especially within Kubernetes environments – Pyrra’s built-in UI is a solid choice. On the other hand, if you’re already using Grafana for monitoring and value flexible, customizable visualizations, Grafana dashboards (SloK) might be a better fit. The right option depends on your infrastructure and whether you prioritize a streamlined interface or more advanced customization options.
What does Pyrra’s performance mode change for accuracy and cost?
Pyrra’s performance mode is designed to boost accuracy while cutting costs. It achieves this by fine-tuning query performance, making it especially effective at managing high-cardinality metrics. Additionally, it reduces cross-zone traffic, which can significantly lower infrastructure-related expenses.