Ultimate Guide to Microservices Observability Frameworks

Microservices are powerful but complex, and observability is your key to managing them effectively. Traditional monitoring can’t keep up with the unpredictable failures in distributed systems. Observability goes deeper by combining metrics, logs, and traces to pinpoint issues, reduce downtime, and improve system reliability.
Here’s the core of what you need to know:
- Metrics: Show system health (e.g., CPU usage, error rates). They’re lightweight and great for real-time alerts.
- Logs: Provide detailed event records to debug root causes (e.g., error messages, stack traces).
- Traces: Map a request’s path across services to find bottlenecks and performance issues.
Tools like OpenTelemetry, Prometheus, Grafana, and Jaeger simplify data collection, monitoring, and tracing. By integrating these tools, you can build a robust observability framework to diagnose problems faster, manage costs with techniques like sampling, and improve your system’s overall reliability.
Quick Tip: Start with basic instrumentation (e.g., OpenTelemetry auto-instrumentation) and focus on critical metrics like latency, traffic, errors, and saturation. Then, expand your efforts with distributed tracing and structured logs for deeper insights.
Observability isn’t just about fixing problems – it’s about understanding your system better. This guide breaks down the essentials to help you get started and optimize your microservices architecture.
OpenTelemetry: Adding Observability to Any Microservices Environment, with Glenn Versweyveld

The 3 Pillars of Observability: Metrics, Logs, and Traces
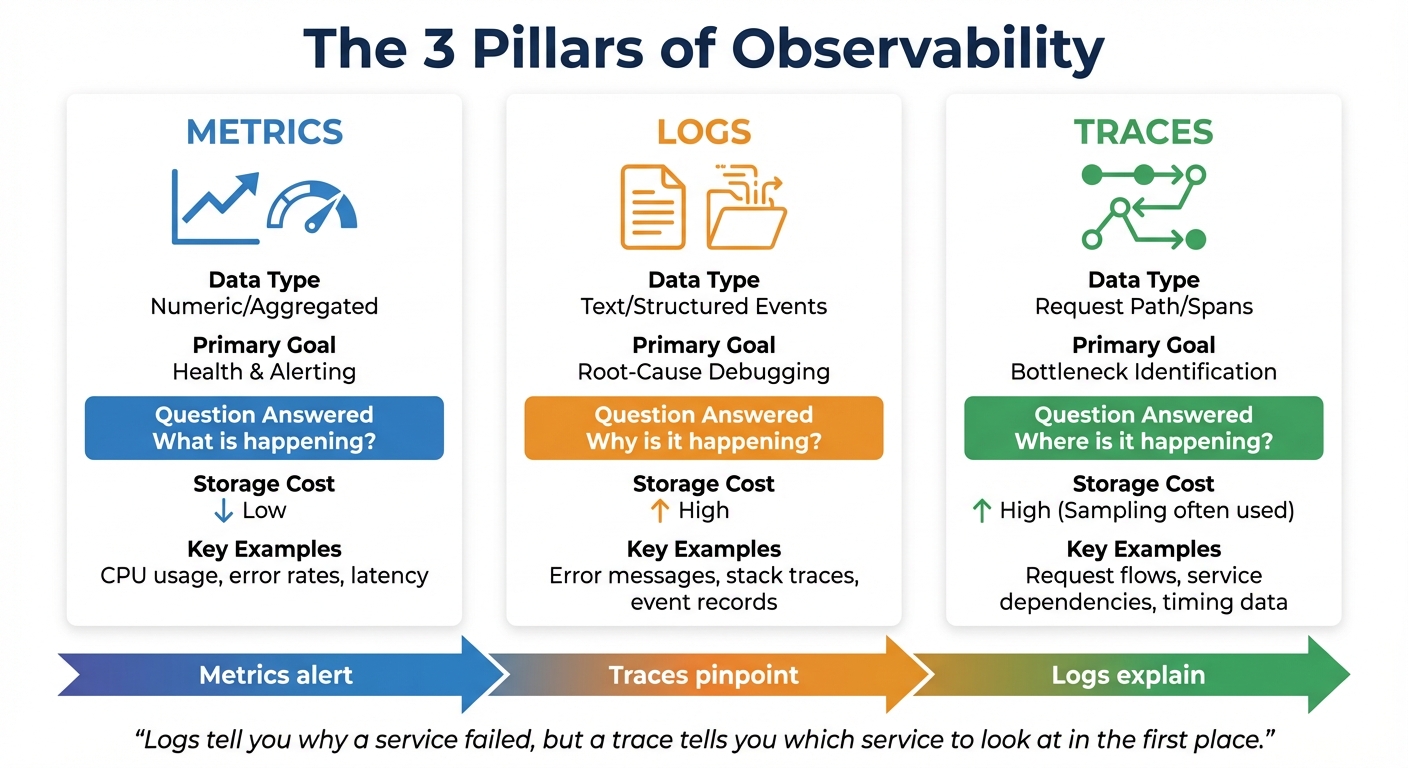
The 3 Pillars of Observability: Metrics, Logs, and Traces Comparison
Let’s dive into the core of observability: metrics, logs, and traces. These three elements work together to answer critical questions about your system – What’s happening? Why is it happening? Where is it happening? Metrics highlight the "what", such as a sudden spike in latency. Logs dig into the "why" by providing detailed error messages. Traces, on the other hand, map the "where" by tracking the journey of a request through your system.
When used together, these pillars create a seamless diagnostic process. Imagine an alert goes off due to a spike in error rates. Metrics give you the heads-up, traces pinpoint the struggling service, and logs uncover the root cause, like a failed API call or a database timeout.
"Logs tell you why a service failed, but a trace tells you which service to look at in the first place." – GeeksforGeeks
| Feature | Metrics | Logs | Traces |
|---|---|---|---|
| Data Type | Numeric/Aggregated | Text/Structured Events | Request Path/Spans |
| Primary Goal | Health & Alerting | Root-Cause Debugging | Bottleneck Identification |
| Question Answered | "What is happening?" | "Why is it happening?" | "Where is it happening?" |
| Storage Cost | Low | High | High (Sampling often used) |
Now, let’s break down each pillar to understand its role in monitoring and troubleshooting.
Metrics: Measuring System Performance
Metrics are all about numbers – they aggregate data over time to give you a sense of your system’s health. Think CPU usage, memory consumption, request rates, or error percentages. Because they’re stored as time-series data, metrics are lightweight and perfect for real-time dashboards and alerts.
Google’s Site Reliability Engineering (SRE) handbook highlights four critical metrics, known as the "Golden Signals": latency (how long requests take), traffic (volume of requests), error rate (percentage of failed requests), and saturation (resource usage like CPU or memory). These signals provide a high-level snapshot of your system’s condition.
The frequency of data collection matters. For example, scraping metrics every 15 seconds captures brief spikes in performance, while a 60-second interval might miss those short-lived issues. When a metric crosses a predefined threshold, it triggers alerts – your first clue that something’s wrong.
Metrics are your early warning system. They tell you something is off, but they don’t explain the "why" or "where." That’s where logs and traces step in.
Logs: Recording Events for Debugging
Logs are essentially detailed event records. They capture everything from routine messages like "User 12345 logged in" to critical errors like stack traces. Each log entry is timestamped, preserving the exact context of what happened and when.
Let’s say you’re alerted to a spike in HTTP 500 errors. Logs help you dig deeper, revealing messages like "Database connection pool exhausted" or "Null pointer exception in payment service." This level of detail is crucial for debugging and fixing issues.
In a microservices setup, each service generates its own logs. Since containers are often short-lived, it’s important to forward logs to a centralized system (like Elasticsearch, Grafana Loki, or OpenSearch) using tools like Fluent Bit or Fluentd. Including metadata, such as trace_id or span_id, ties logs back to their source, making it easier to connect the dots.
Traces: Mapping Distributed Transactions
Traces are like a map for understanding how a request moves through your system. They follow a single user request as it interacts with various services, breaking the journey into spans – individual tasks like HTTP requests or database queries. Each span includes timing data and unique identifiers to maintain the sequence of events.
Traces answer the "where" question. For instance, if a user experiences a slow page load, a trace might reveal that the delay is caused by a third-party payment API, even though other services responded quickly.
Companies like Uber, which handle millions of requests per minute, rely on tools like Jaeger for distributed tracing. This helps them visualize request flows and identify bottlenecks in real time. Similarly, Netflix uses Zipkin alongside Atlas to monitor latencies and ensure smooth operations across thousands of microservices.
Effective tracing depends on context propagation – the process of passing unique Trace IDs and Span IDs through HTTP headers (like the W3C traceparent header) or message queues. Without this, each service would generate isolated spans, making it impossible to piece together a complete transaction.
Because traces generate large amounts of data, most systems sample them. This means retaining traces for errors or high-latency events while discarding routine ones. It’s a cost-effective way to focus on critical issues without overwhelming your storage.
Top Observability Tools and Frameworks for Microservices
Now that you’re familiar with the three pillars of observability, let’s explore the tools that bring them to life. When used together, these frameworks can turn raw telemetry data into actionable insights. Tools like OpenTelemetry, Prometheus, Grafana, and Jaeger each play unique roles – OpenTelemetry sets the standard for data collection, Prometheus and Grafana handle metrics and visualization, while Jaeger focuses on distributed tracing.
OpenTelemetry: A Unified Approach to Data Collection
OpenTelemetry (OTel) has quickly become the go-to standard for collecting metrics, logs, and traces. As a project under the Cloud Native Computing Foundation (CNCF), it offers vendor-neutral APIs, SDKs, and tools that simplify instrumenting your services across all three observability pillars. With OTel, you can instrument your code once and export data to any of the 90+ observability platforms that support it.
"OpenTelemetry is a collection of APIs, SDKs, and tools. Use it to instrument, generate, collect, and export telemetry data (metrics, logs, and traces) to help you analyze your software’s performance and behavior." – OpenTelemetry.io
One standout feature of OpenTelemetry is its Collector, a vendor-agnostic proxy that processes and routes telemetry data. The Collector can filter, sample, or redact sensitive information, then export the data to multiple backends simultaneously. For instance, you can send metrics to Prometheus and traces to Jaeger without modifying your application code. Even Google Cloud has adopted OpenTelemetry for exporting trace data across its infrastructure, making monitoring and troubleshooting more streamlined.
OTel supports both automatic instrumentation (zero-code setup for frameworks like Spring Boot or ASP.NET) and manual instrumentation for custom business metrics. With Kubernetes version 1.35, spans can now be exported directly using the OpenTelemetry Protocol (OTLP), solidifying OTel’s role in cloud-native environments.
Once data collection is standardized, tools like Prometheus and Grafana take over to monitor and visualize metrics.
Prometheus and Grafana: Monitoring Made Simple
Prometheus is an open-source toolkit designed for reliability. Using a pull-based model, it collects numeric time-series data by scraping metrics from your services at regular intervals. Its query language, PromQL, allows for detailed data analysis, enabling custom alerts and dashboards.
"Prometheus is designed for reliability, to be the system you go to during an outage to allow you to quickly diagnose problems." – Prometheus.io
As the second project to join the CNCF (after Kubernetes), Prometheus has become the default choice for Kubernetes-native monitoring. However, it’s not built for tasks requiring absolute precision, such as per-request billing. Instead, it excels at identifying trends and patterns.
Grafana complements Prometheus by transforming raw metrics into visually engaging dashboards. It integrates seamlessly with Prometheus, Jaeger, and other backends, offering tools like heatmaps and histograms to help you identify patterns and correlate data from multiple sources.
Together, Prometheus and Grafana offer a lightweight, scalable solution for monitoring and visualization. While they focus on metrics, Jaeger steps in to handle distributed tracing.
Jaeger: Tracing Requests Across Microservices
Jaeger is an open-source tool tailored for distributed tracing. It tracks the path of a request as it moves through your microservices, breaking it down into spans that reveal timing data and dependencies. This makes it easier to diagnose bottlenecks and troubleshoot errors in real time.
Since Jaeger is OpenTelemetry-native, it integrates effortlessly with OTel for data collection. It’s highly scalable, making it ideal for environments with dozens or even hundreds of services. Given the high volume of data generated by tracing, Jaeger includes sampling strategies to manage storage costs. For example, head-based sampling traces a fixed percentage of requests, while tail-based sampling retains traces with errors or high latency.
Jaeger answers the "where" question by pinpointing the exact service causing a slowdown. When combined with Prometheus (to understand "what") and logs (to uncover "why"), it completes the observability toolkit for microservices.
sbb-itb-f9e5962
How to Implement Observability in Microservices
To get started with observability in microservices, begin by instrumenting your RPC layers and web frameworks. Gradually add more detailed instrumentation for high-value transactions. While most organizations already rely heavily on metrics (95%) and logs (87%), only 57% have adopted distributed traces – a critical component that ties everything together in a microservices setup.
Start with broad instrumentation and gradually expand. This approach helps you focus on capturing the most essential data without overwhelming your system. Below are some effective practices to help you instrument microservices efficiently.
Best Practices for Instrumenting Metrics, Logs, and Traces
Utilize auto-instrumentation tools like those available for Express, Spring Boot, and ASP.NET to reduce the need for manual coding. For scaling companies, manual instrumentation can quickly become a bottleneck. Tools like OpenTelemetry offer auto-instrumentation agents for Java, Python, and Node.js that work right out of the box.
Track Golden Signals as your baseline metrics. These include:
- Latency: Request duration
- Traffic: Requests per second
- Errors: Failed request rates
- Saturation: CPU or memory utilization
These metrics help identify the most critical issues during outages.
Maintain continuous distributed traces by ensuring each service forwards its trace_id using the W3C traceparent header. Logs should also include trace and span identifiers for seamless correlation with traces.
Adhere to semantic conventions. Use standard naming for attributes like http.method, http.status_code, and url.path. This ensures observability tools can interpret and visualize your data without extra configuration. OpenTelemetry provides a detailed set of semantic conventions to ensure compatibility across platforms.
"An application is properly instrumented when developers don’t need to add more instrumentation to troubleshoot an issue, because they have all of the information they need." – OpenTelemetry
Be cautious with cardinality. Avoid using high-cardinality data like user_id or order_id as metric labels, as this can create an enormous number of time series and inflate storage costs. Instead, keep this level of detail in traces or logs. Metrics should focus on aggregated patterns rather than individual transactions.
Optimizing Observability Costs Without Losing Coverage
On average, observability accounts for 17% of infrastructure budgets, though the median is closer to 10%. Once you’ve established effective instrumentation, managing costs becomes crucial.
Use tail sampling with the OpenTelemetry Collector to retain important error or slow traces while reducing storage of successful ones. Unlike head-based sampling, which makes decisions at the start of a request, tail sampling evaluates traces at the end. This allows you to keep all critical error traces while sampling only a fraction of healthy requests.
Define Service Level Objectives (SLOs) – for example, ensuring 99% of checkouts happen in under one second. This reduces alert fatigue, which is a major barrier to faster incident response, and helps teams focus on issues that directly impact users.
Adopt structured JSON logging with metadata like trace_id. This approach streamlines troubleshooting and reduces log volume, as you can filter logs more effectively. By focusing on structured logs, you avoid the need to store excessive amounts of data.
Centralizing observability under a dedicated team can also reduce complexity. Organizations with centralized observability teams report fewer struggles with system complexity (29%) compared to those with isolated teams (49%). As your company grows, consider forming a centralized team to standardize practices and manage costs across services.
Using Observability to Debug Microservices and Reduce Downtime
With strong instrumentation in place, automated health checks and whitebox monitoring can quickly pinpoint failures. Observability not only accelerates issue resolution but also minimizes downtime. For instance, if a checkout process fails, distributed traces can identify the exact service causing the problem and how long each step took. Logs with matching trace_id allow you to jump directly to the relevant error message.
Automate health checks to ensure only healthy service instances handle traffic. This prevents cascading failures caused by requests piling up on unhealthy instances. Health check APIs should verify more than just uptime – they need to confirm that the service can process requests, checking database connections and dependencies as well.
Prioritize whitebox metrics over blackbox checks. While blackbox monitoring (external pings) tells you "what" is broken, whitebox monitoring (internal instrumentation) reveals "why" it failed. In a microservices environment, understanding the "why" is critical since failures often cascade across multiple services.
The adoption of SaaS observability platforms has grown by 42% year-over-year, with 37% of organizations now using managed services instead of self-hosting. For many companies, the complexity of maintaining a self-managed stack like Prometheus/Grafana/Jaeger outweighs the cost savings, especially when downtime translates to lost revenue. TECHVZERO‘s DevOps solutions can help you implement and optimize observability frameworks, whether you’re managing your own stack or transitioning to a managed platform.
Conclusion
Observability plays a key role in microservices, transforming hours of troubleshooting into mere minutes by enabling you to trace requests as they move through multiple services. In distributed systems, where a single request can touch several services, being able to follow its path and identify where things go wrong is absolutely crucial for keeping operations running smoothly.
To tackle these challenges, consider using OpenTelemetry as your foundation. Its vendor-neutral design and widespread adoption – used by 75% of teams – make it easier to switch backends without the headache of re-instrumenting your system. Align the "three pillars" of observability – metrics, logs, and traces – by using consistent trace IDs and standard conventions like http.status_code and service.name.
"Observability lets you understand a system from the outside by letting you ask questions about that system without knowing its inner workings." – OpenTelemetry.io
Beyond improving visibility, managing costs is just as important. You can cut expenses by using edge processing, which reduces data egress by up to 90%, and tail sampling to store only the most critical error traces. To avoid overwhelming your team with unnecessary alerts, define Service Level Objectives (SLOs) based on user experience rather than infrastructure metrics. This approach keeps your team focused on what truly matters.
Start by instrumenting your most critical services, use auto-instrumentation to gain quick insights, and expand your efforts based on lessons learned from incidents. Whether you’re building a brand-new microservices framework or enhancing an existing one, TECHVZERO’s DevOps solutions can help you implement observability strategies that minimize downtime and control costs.
FAQs
How do metrics, logs, and traces work together in microservices observability?
Metrics, logs, and traces form the backbone of observability, each offering a distinct lens into your system’s behavior. Metrics deliver numerical snapshots – like CPU usage, request latency, or error rates – that highlight anomalies and trigger alerts. Logs dive deeper, capturing time-stamped details such as error messages or stack traces to explain why an issue occurred. Meanwhile, traces map the path of a request as it moves through various services, identifying where bottlenecks or failures arise.
When these tools work together, troubleshooting becomes much more efficient. For instance, a metric alert might flag a potential issue, logs can provide the necessary context, and traces can pinpoint the exact service causing the slowdown. This cohesive approach not only minimizes downtime but also boosts system reliability and ensures smoother operations. With TECHVZERO, you can build observability pipelines that integrate metrics, logs, and traces, turning raw data into actionable insights.
What is OpenTelemetry’s role in microservices observability?
OpenTelemetry is an open-source framework that provides a standardized way to gather, process, and export telemetry data – like traces, metrics, and logs – from microservices. It serves as a unified instrumentation layer, simplifying the monitoring of distributed systems and enabling seamless integration with various observability tools.
With OpenTelemetry, organizations can better understand how their systems are performing, quickly identify and resolve issues, and improve overall operations – all without locking themselves into a single vendor or platform. Its adaptability and broad compatibility make it an essential tool for monitoring modern microservice architectures.
What are some effective ways to manage the costs of implementing observability in microservices?
To keep observability costs under control, start by reducing the data volume you collect. Focus on ingesting and filtering only the metrics and logs that are most relevant to your needs. You can also implement granular retention policies to manage how long data is stored and use tiered storage to save less critical data in more cost-efficient ways.
Another smart approach is to use automation tools to create streamlined and efficient data pipelines. Collaborating with experts, such as TECHVZERO, can further help fine-tune your system’s performance, cut down on manual work, and make better use of resources – all of which can lead to noticeable cost savings.